 Skip to main content
- What is Gross Margin?
- How to Calculate Gross Margin
- Gross Margin Formula
- Gross Margin Calculation Example
- What is a Good Gross Profit Margin?
- Gross Margin vs. Net Profit Margin: What is the Difference?
- How to Improve Gross Profit Margin Ratio
- Gross Margin Calculator
- 1. Income Statement Assumptions
- 2. Gross Profit Margin Calculation Example
- 3. Gross Profit Margin Ratio Analysis
What is Gross Margin?
The Gross Margin is a profitability ratio that measures the percentage of revenue remaining after deducting the cost of goods sold (COGS) incurred in the period.
Since only direct costs are accounted for in the metric, the gross profit margin ratio reflects the income available for meeting fixed costs and other non-operating expenses.
- The gross margin is a measure of profitability that compares a company’s gross profit to its revenue in the corresponding period.
- The formula to calculate gross margin divides a company’s gross profit in a given period by its revenue.
- The gross profit margin is the ratio between gross profit and revenue, expressed as a percentage.
- The gross margin reflects the percentage of each dollar of revenue that a company retains as gross profit.
- The higher the gross margin ratio, the more revenue that remains upon subtracting cost of goods sold (COGS), which can be allocated towards operating expenses and non-operating costs.
How to Calculate Gross Margin
The gross margin is the revenue remaining upon subtracting cost of goods sold (COGS), expressed as a percentage.
Calculating a company’s gross margin involves dividing its gross profit by the revenue in the matching period.
The two metrics necessary to calculate the gross margin—the gross profit and net revenue—are each recognized on the GAAP-based income statement.
The gross margin answers the question of, “How much in gross profit is kept per dollar of revenue generated?”
- Gross Profit ➝ The gross profit is the remaining revenue after subtracting direct costs (COGS)
- Cost of Goods Sold (COGS) ➝ The cost of goods sold (COGS) are the direct costs incurred by a company directly tied to the production and delivery of specific goods and services (and are usually variable costs).
In accordance with GAAP accounting standards, the cost of goods sold (COGS) is matched to the associated revenues in the same time period, commonly known as the “matching principle”.
Common examples of direct costs recognized under the cost of goods sold (COGS) line item include the following examples:
- Direct Labor Costs
- Purchase of Raw Materials (i.e. Inventory)
The process of calculating the gross profit margin is as follows:
- Step 1 ➝ Obtain Net Revenue and COGS from Income Statement
- Step 2 ➝ Calculate Gross Profit (Revenue Less COGS)
- Step 3 ➝ Divide Gross Profit by Revenue
- Step 4 ➝ Convert into Percentage Form (Multiply by 100)
Gross Margin Formula
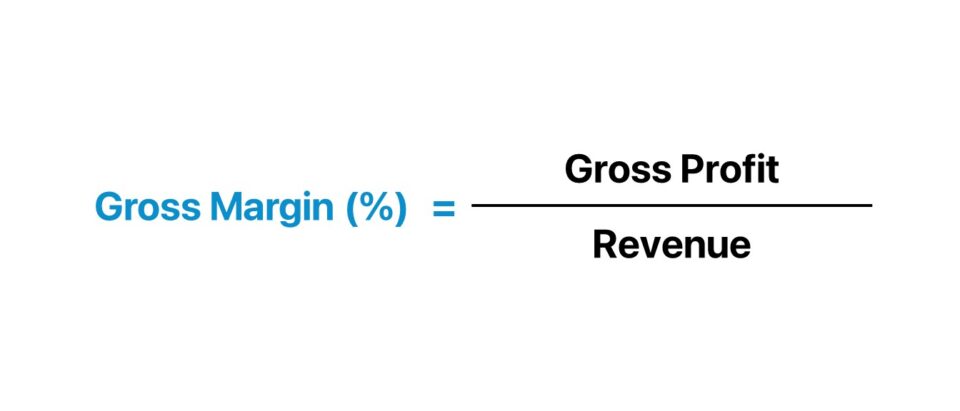
The formula to calculate the gross margin is equal to gross profit divided by net revenue.
Where:
- Gross Profit = Net Revenue – Cost of Goods Sold (COGS)
- Net Revenue = Gross Revenue – Returns – Discounts – Sales Allowances
To express the metric in percentage form, the resulting decimal value figure must be multiplied by 100.
Gross Margin Calculation Example
Suppose a retail business generated $10 million in revenue, with $8 million in COGS in the fiscal year ending 2023.
- Revenue = $10 million
- Cost of Goods Sold (COGS) = $8 million
The gross profit of the retail business – the difference between revenue and COGS – is $2 million here.
- Gross Profit = $10 million – $8 million = $2 million
Upon dividing the $2 million in gross profit by the $10 million in revenue, and then multiplying by 100, we arrive at 20% as our gross profit margin for the retail business.
- Gross Profit Margin (%) = $2 million ÷ $10 million = 0.20, or 20%
So, what does the 20% gross margin mean?
The gross margin represents the percentage of a company’s revenue retained as gross profit, expressed on a per-dollar basis.
Therefore, the 20% gross margin implies the company retains $0.20 for each dollar of revenue generated, while $0.80 is attributable to the incurred cost of goods sold (COGS).
What is a Good Gross Profit Margin?
Interpreting a company’s gross margin as either “good” or “bad” depends substantially on the industry in which the company operates.
Generally put, a higher gross profit margin is perceived positively in practically all industries, since the potential for higher operating margins and net profit margins increases.
For a practical comparison, the companies in the peer group must operate in the same (or adjacent) industry with readily available historical data dating back several years to better understand the industry norms, including cyclical and seasonal patterns.
- Higher Gross Margin (%) ➝ For example, software companies have been known for having high profit gross margins, while clothing retailers have historically exhibited razor-thin gross margins and rely on volume to remain profitable. Service-based industries also tend to have higher gross margins, since the COGS for such businesses are minimal (e.g. consulting firms).
- Lower Gross Margin (%) ➝ In contrast, capital-intensive companies (e.g. manufacturing, industrials, retail) normally have lower gross profit margins due to margin erosion from the direct costs related to building up inventory, manufacturing products, etc. Nevertheless, such industries with significant direct costs can still consist of market leaders with consistent profits that retain meaningful market shares (e.g. airlines, transportation, retail).
However, a credible analysis of a company’s gross margin is contingent on understanding its business model, unit economics, and specific industry dynamics.
Learn More → Profit Margins by Sector (Damodaran)
Gross Margin vs. Net Profit Margin: What is the Difference?
The difference between the gross margin and net profit margin pertains to the type of expenses deducted from the profit metric.
- Gross Margin → The gross margin only accounts for one outflow of cash – the cost of goods sold (COGS) – which are the direct costs associated with the production of revenue. The gross profit margin, contrary to the net profit margin, is largely unaffected by financing decisions or discretionary accounting policies, such as useful life assumptions for purchases of PP&E or differences in the tax rate, making it better suited for peer comparisons, as there is far lower potential for manipulation via discretionary accounting decisions by management.
- Net Profit Margin → In contrast, the net profit margin accounts for all expenses – operating expenses and non-operating expenses – hence the numerator is net income (the “bottom line”). The fact that net income is “levered” (post-interest) and attributable to solely common equity shareholders is one of the main drawbacks to the net profit margin metric.
How to Improve Gross Profit Margin Ratio
The common methods for companies to improve their gross margin ratio include the following:
- Increase Average Selling Price (ASP) ➝ Requires Pricing Power, Upselling, etc.
- Purchase Inventory at Lower Prices ➝ Requires Negotiating Leverage with Suppliers (e.g. High Order Volume/Frequency, Bulk Purchases, Branding)
- Integrate Higher Margin Products or Services ➝ Cross-Selling or Bundling New Products and Services with Higher Margins Improves Customer Retention
Gross Margin Calculator
We’ll now move on to a modeling exercise, which you can access by filling out the form below.
1. Income Statement Assumptions
Suppose we’re tasked with calculating the gross margin of three companies operating in the same industry.
The revenue and cost of goods sold (COGS) of each company is listed in the section below.
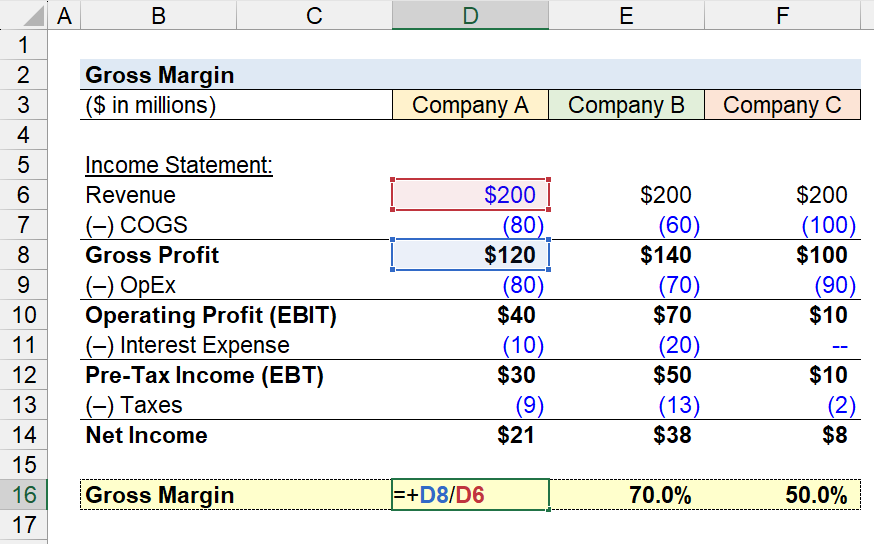
Income Statement – Company A
- Revenue = $200 million
- Cost of Goods Sold (COGS) = ($80 million)
Income Statement – Company B
- Revenue = $200 million
- Cost of Goods Sold (COGS) = ($60 million)
Income Statement – Company C
- Revenue = $200 million
- Cost of Goods Sold (COGS) = ($100 million)
2. Gross Profit Margin Calculation Example
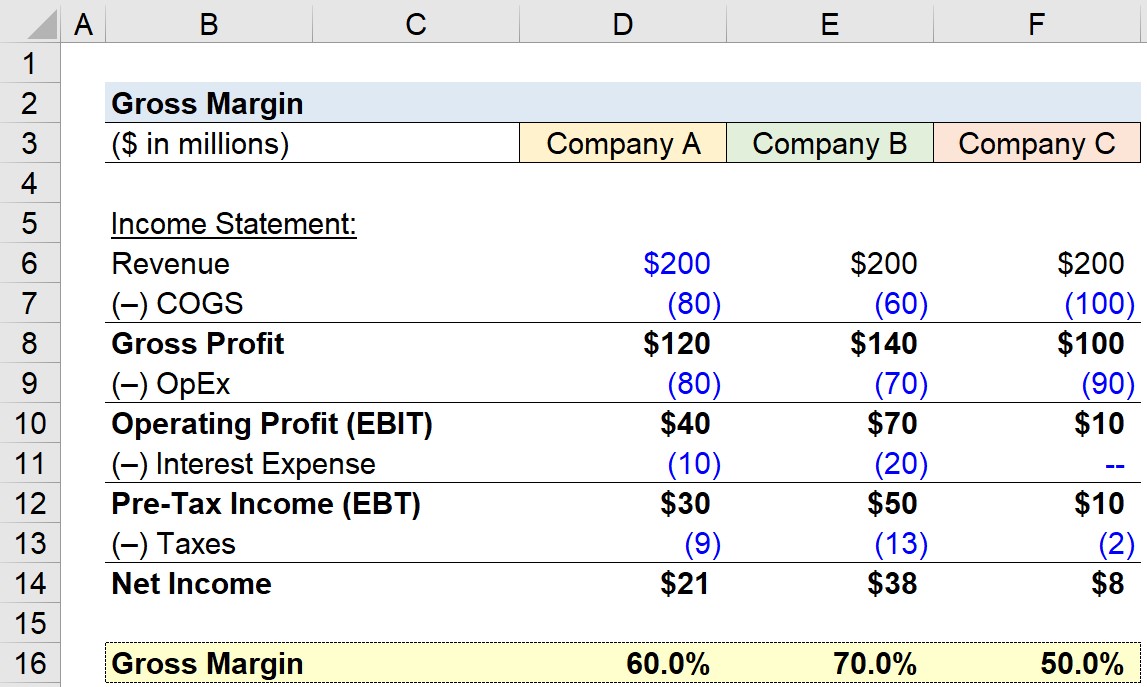
Using these figures, we can calculate the gross profit for each company by subtracting COGS from revenue.
- Gross Profit, Company A → $200 million – $80 million = $120 million
- Gross Profit, Company B → $200 million – $60 million = $140 million
- Gross Profit, Company C → $200 million – $100 million = $100 million
Next, the gross profit of each company is divided by revenue to arrive at the gross profit margin metric.
- Gross Margin (%), Company A → $120 million ÷ $200 million = 60.0%
- Gross Margin (%), Company B → $140 million ÷ $200 million = 70.0%
- Gross Margin (%), Company C → $100 million ÷ $200 million = 50.0%
3. Gross Profit Margin Ratio Analysis
Irrespective of the differences in operating expenses (OpEx), interest expenses, and tax rates among these companies, none of these differences are captured in gross margin.
The gross margin isolates the profits only after COGS is factored in, which makes the metric more informative for peer group comparisons.
Since COGS were already taken into account, the remaining funds are available to be used to pay operating expenses (OpEx), interest expenses, and taxes.
For instance, the operating profit margin, which accounts for COGS and OpEx, is 20% for Company A, 35% for Company B, and 5% for Company C.
- Operating Profit Margin (%), Company A → $40 million ÷ $200 million = 20.0%
- Operating Profit Margin (%), Company B → $70 million ÷ $200 million = 35.0%
- Operating Profit Margin (%), Company C → $10 million ÷ $200 million = 5.0%
In conclusion, gross margin should be used in conjunction with other profitability metrics to form a comprehensive understanding of a company’s cost structure, unit economics, and business model.

Everything You Need To Master Financial Modeling
Enroll in The Premium Package: Learn Financial Statement Modeling, DCF, M&A, LBO and Comps. The same training program used at top investment banks.
Enroll Today


