
- What are Valuation Multiples?
- How to Calculate Valuation Multiples?
- Valuation Multiple Formula
- What are the Different Types of Valuation Multiples?
- Enterprise Value Multiples vs. Equity Value Multiples: What is the Difference?
- Valuation Multiples Calculator
- 1. Financial Assumptions and Equity Value Calculation
- 2. Enterprise Value Calculation (TEV)
- 3. Valuation Multiples Calculation Example
- Trailing vs. Forward Multiples: What is the Difference?
What are Valuation Multiples?
Valuation Multiples are ratios that reflects the implied value of companies in relation to a specific operating metric. Usage of a valuation multiple – a standardized financial metric – facilitates performing comps analysis among peer companies with different characteristics, most notably size.

How to Calculate Valuation Multiples?
The basis of relative valuation is to approximate the value of an asset (i.e. the company) by looking at the market values of similar, comparable companies.
The median or mean of the industry peer group serves as a useful point of reference to determine the worth of the target company.
A valuation using comps has the distinct advantage of reflecting “reality” since the value is based on actual, readily observable trading prices.
However, the absolute value of companies – such as equity value or enterprise value – cannot be compared on their own.
A simple analogy is comparing the prices of houses – the absolute prices of the houses themselves provide minimal insights due to size differences between houses and other factors.
Therefore, standardization of the valuation of companies is required to facilitate meaningful comparisons that are actually practical.
Valuation Multiple Formula
Valuation multiples consist of two components:
- Numerator → Value Measure (Enterprise Value or Equity Value)
- Denominator → Value Driver – i.e. Financial or Operating Metric (EBITDA, EBIT, Revenue, etc.)
The numerator is going to be a measure of value, such as equity value or enterprise value, whereas the denominator will be a financial (or operating) metric.
A mandatory rule is that the represented investor group in the numerator and the denominator must match.
Note that for any valuation multiple to be meaningful, a contextual understanding of the target company and its sector must be well-understood (e.g. fundamental drivers, competitive landscape, industry trends).
Hence, operating metrics specific to an industry can also be used. For example, the number of daily active users (DAUs) could be used for an internet company, as the metric could depict the value of a company better than a standard profitability metric.
What are the Different Types of Valuation Multiples?
For a valuation multiple to be practical, the represented capital provider (e.g. equity shareholder, debt lender) must match in the numerator and denominator.
- Enterprise Value → If the numerator is enterprise value (TEV), metrics such as EBIT, EBITDA, revenue, and unlevered free cash flow (FCFF) could be used as the denominator, since all these metrics are unlevered (i.e. pre-debt). Thus, these metrics coincide with enterprise value, which is the valuation of a company independent of the capital structure.
- Equity Value → Conversely, if the numerator is equity value, metrics such as net income, levered free cash flow (FCFE), and earning per share (EPS) can be used, since these are all levered (i.e. post-debt) metrics.
Enterprise Value Multiples vs. Equity Value Multiples: What is the Difference?
In the chart below, some commonly used enterprise value and equity value-based valuation multiples are listed:
| Enterprise Value Multiples | Equity Value Multiples |
Note that the denominator in these valuation multiples standardizes the absolute valuation (enterprise value or equity value). Similarly, homes are often expressed in terms of sq. footage, which helps standardize value for differently sized homes.
Based on the circumstances, industry-specific multiples can oftentimes be used.
For example, EV/EBITDAR is frequently seen in the transportation industry (i.e. rental costs are added back to EBITDA), while EV/(EBITDA – Capex) is frequently used for industrials and other capital-intensive industries like manufacturing.
In practice, the EV/EBITDA multiple is the most commonly used, followed by EV/EBIT, especially in the context of M&A.
The P/E ratio is typically used by retail investors, while P/B ratios are used far less often and normally only seen when valuing financial institutions (i.e. banks).
When it comes to unprofitable companies, the EV/Revenue multiple is frequently used, as it’s sometimes the only meaningful option (e.g. EBIT could be negative, making the multiple meaningless).
Valuation Multiples Calculator
We’ll now move on to a modeling exercise, which you can access by filling out the form below.
1. Financial Assumptions and Equity Value Calculation
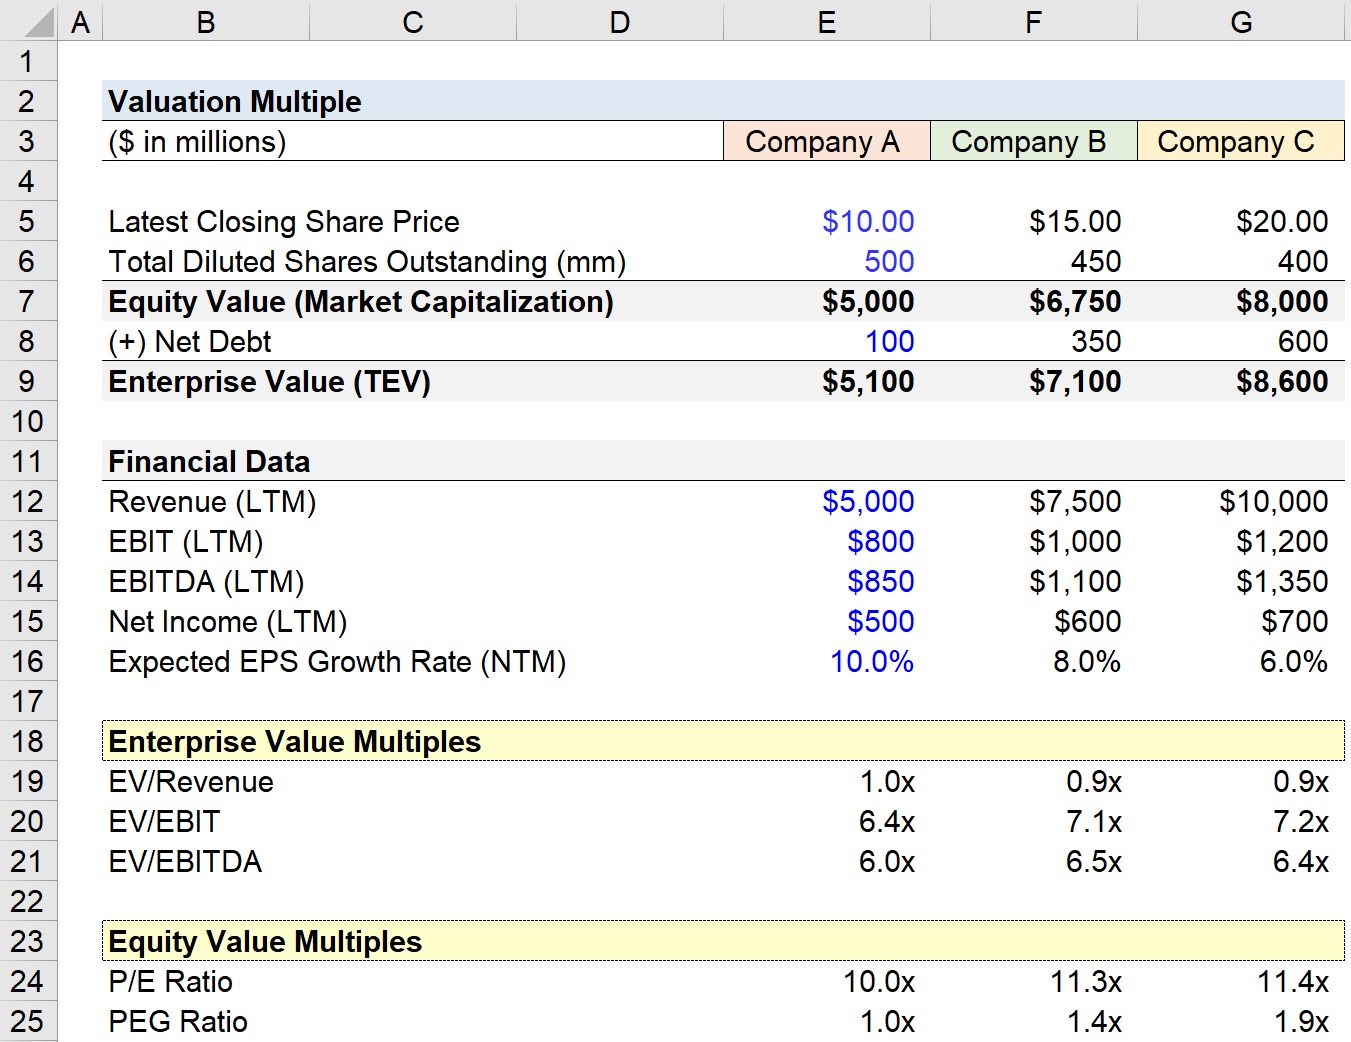
To start, we have three different companies with the following financial data:
- Company A: $10.00 Share Price and 500mm Diluted Shares Outstanding
- Company B: $15.00 Share Price and 450mm Diluted Shares Outstanding
- Company C: $20.00 Share Price and 400mm Diluted Shares Outstanding
Since the equity market – otherwise known as the market capitalization – is equal to the share price multiplied by the total diluted share count, we can calculate the market cap for each.
From Company A to C, the market caps are $5bn, $6.75bn, and $8bn, respectively.
- Company A, Equity Value: $10.00 * 500mm = $5bn
- Company B, Equity Value: $15.00 * 450mm = $6.75bn
- Company C, Equity Value: $20.00 * 400mm = $8bn
2. Enterprise Value Calculation (TEV)
In the next part, we’ll add the net debt assumptions to the equity values of each company to compute the enterprise value.
- Company A, Enterprise Value: $5bn + $100mm = $5.1bn
- Company B, Enterprise Value: $6.75bn + $350mm = $7.1bn
- Company C, Enterprise Value: $8bn + $600mm = $8.6bn
Here, we’re just using the simplistic assumption that larger companies hold more debt on their balance sheets.
3. Valuation Multiples Calculation Example
Now, the valuation portion of our exercise (i.e. the numerator) is finished, and the remaining step is to calculate the financial metrics (i.e. the denominator), which have been posted below:
We now have all the necessary inputs to calculate the valuation multiples.
The following formulas were used to compute the valuation multiples:
- EV/Revenue = Enterprise Value ÷ LTM Revenue
- EV/EBIT = Enterprise Value ÷ LTM EBIT
- EV/EBITDA = Enterprise Value ÷ LTM EBITDA
- P/E Ratio = Equity Value ÷ Net Income
- PEG Ratio = P/E Ratio ÷ Expected EPS Growth Rate
In conclusion, multiples are shorthand valuation metrics used to standardize a company’s value on a per-unit basis, because absolute values cannot be compared between different companies.
Given the company data in our modeling exercise was standardized, we can derive more informative insights from the comparison.
In lieu of standardization, comparisons would be close to meaningless, and it would be challenging to determine whether a company is undervalued, overvalued, or fairly valued versus comparable peers.
Trailing vs. Forward Multiples: What is the Difference?
Oftentimes, you’ll come across comps sets with forward multiples. For example, “12.0x NTM EBITDA”, which simply means the company is valued at 12.0x its projected EBITDA in the next twelve months.
Using historical (LTM) profits has the advantage of being actual, proven results, which is important because EBITDA, EBIT, and EPS forecasts are subjective and especially problematic for smaller public firms, whose guidance is less reliable and harder to obtain.
That said, LTM suffers from the problem that historical results are typically distorted by non-recurring expenses and income, misrepresenting the company’s future, recurring operating performance.
When using LTM results, non-recurring items must be excluded to get a “clean” multiple. In addition, companies are regularly acquired based on their future potential, making forward multiples more relevant.
Therefore, rather than picking one, both LTM and forward multiples are often presented side-by-side.

Comparable Companies Analysis Output Sheet (Source: WSP Trading Comps Course)

Everything You Need To Master Financial Modeling
Enroll in The Premium Package: Learn Financial Statement Modeling, DCF, M&A, LBO and Comps. The same training program used at top investment banks.
Enroll Today


")
