 Skip to main content
- What is Price to Cash Flow?
- How to Calculate Price to Cash Flow Ratio (P/CF)?
- Price to Cash Flow Ratio Formula (P/CF)
- What is a Good Price to Cash Flow Ratio?
- Price to Cash Flow (P/CF) vs. Price to Earnings (P/E)
- P/CF Ratio Limitations
- Price to Cash Flow Calculator (P/CF)
- 1. P/CF Ratio Model Assumptions
- 2. Price to Cash Flow Calculation Example
What is Price to Cash Flow?
The Price to Cash Flow Ratio (P/CF) evaluates the valuation of a company’s stock by comparing its share price to the amount of operating cash flow produced.
Unlike the price-to-earnings ratio (P/E), the P/CF ratio removes the impact of non-cash items such as depreciation & amortization (D&A), which makes the metric less prone to manipulation via discretionary accounting decisions.
How to Calculate Price to Cash Flow Ratio (P/CF)?
The price to cash flow ratio (P/CF) is a common method used to assess the market valuation of publicly-traded companies, or more specifically, to decide if a company is undervalued or overvalued.
The P/CF ratio formula compares the equity value (i.e. market capitalization) of a company to its operating cash flows.
- Market Capitalization: The market capitalization (or “market cap”) is calculated by multiplying the latest closing share price by the total number of diluted shares outstanding.
- Cash Flow from Operations (CFO): While operating cash flow typically refers to cash from operations from the cash flow statement (CFS), other variations of levered cash flow metrics could be used, instead. On the cash from operations (CFO) section of the CFS, the starting line item is net income, which is adjusted for non-cash items like D&A and changes in net working capital (NWC).
In short, the P/CF represents the amount that investors are currently willing to pay for each dollar of operating cash flow generated by the company.
Learn More → Valuation Multiple
Price to Cash Flow Ratio Formula (P/CF)
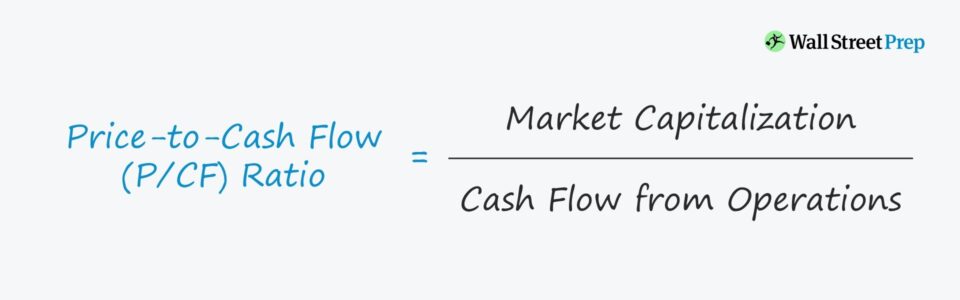
The formula for P/CF is simply the market capitalization divided by the operating cash flows of the company.
Alternatively, P/CF can be calculated on a per-share basis, in which the latest closing share price is divided by the operating cash flow per share.
To calculate the operating cash flow per share, there are two financial metrics required:
- Cash from Operations (CFO): The company’s annual operating cash flow.
- Total Diluted Shares Outstanding: The total number of total outstanding shares, inclusive of the effect of potentially dilutive securities like options and convertible debt.
By dividing the two figures, we arrive at the operating cash flow on a per-share basis, which must be done to match the numerator (i.e. the market share price).
Note that the share price used in the formula must reflect a “normalized” share price; i.e., that there are no abnormal, share price movements temporarily affecting the current market valuation.
Otherwise, the P/CF will be skewed by one-time, non-recurring events (e.g. news leakage of potential M&A).
What is a Good Price to Cash Flow Ratio?
The P/CF is most useful for evaluating companies that have positive operating cash flow but are not profitable on an accrual accounting basis due to non-cash charges.
In other words, a company could have negative net income yet be profitable (in terms of generating positive cash flows) after non-cash expenses are added back.
Following the adjustments to net income, which is the purpose of the top section of the cash flow statement, we can get a much better sense of the company’s profitability.
Regarding the general rules for interpreting the P/CF ratio:
- Low P/CF Ratio: The company’s shares could potentially be undervalued by the market – but further analysis is required.
- High P/CF Ratio: The company’s share price could potentially be overvalued by the market, but again, there might be a particular reason as to why the company is trading at a higher valuation than peer companies. Further analysis is still required.
Price to Cash Flow (P/CF) vs. Price to Earnings (P/E)
Equity analysts and investors often prefer the P/CF ratio over the price-to-earnings (P/E) since accounting profits – the net earnings of a company – can be manipulated more easily than operating cash flow.
Hence, certain analysts prefer the P/CF ratio over the P/E ratio, since they view P/CF as a more accurate depiction of a company’s earnings.
P/CF is especially useful for companies with positive free cash flow, which we are defining as cash from operations (CFO), but are not profitable at the net income line because of substantial non-cash charges.
Non-cash charges are added back to the cash flow statement in the cash from operations section to reflect that they are not actual outflows of cash. For example, depreciation is added back because the real outflow of cash occurred on the date of the capital expenditure (Capex).
To comply with accrual accounting rules, the purchase of fixed assets must be spread across the useful life of the asset. The issue, however, is that the useful life assumption can be discretionary and thereby creates the opportunity for misleading accounting practices.
Either way, both the P/CF and P/E ratios are used widely among retail investors, primarily for their convenience and ease of calculating.
P/CF Ratio Limitations
- Capital Expenditure (Capex): The main limitation of the P/CF ratio is the fact that capital expenditures (Capex) are not removed from operating cash flow. Considering the significant impact Capex has on the cash flows of a company, the ratio of a company can be skewed by the exclusion of Capex.
- Limited or Lack of Profitability: Next, similar to the P/E ratio, the P/CF ratio cannot be used for truly unprofitable companies, even after adjusting for non-cash expenses. In such scenarios, the P/CF will not be meaningful and other revenue-based metrics such as the price-to-sales multiple would be more useful.
- Early-Stage Companies: Further, for companies in their very early stages of development, high P/CF ratios are going to be the norm, and comparisons to mature companies in different stages in their lifecycles will not be too informative. High-growth companies are mostly valued based on their future growth prospects and the potential to someday become more profitable once growth slows down. Depending on the industry, the average P/CF will be different, although a lower ratio is generally considered to be a sign that the company is relatively undervalued.
Price to Cash Flow Calculator (P/CF)
We’ll now move to a modeling exercise, which you can access by filling out the form below.
1. P/CF Ratio Model Assumptions
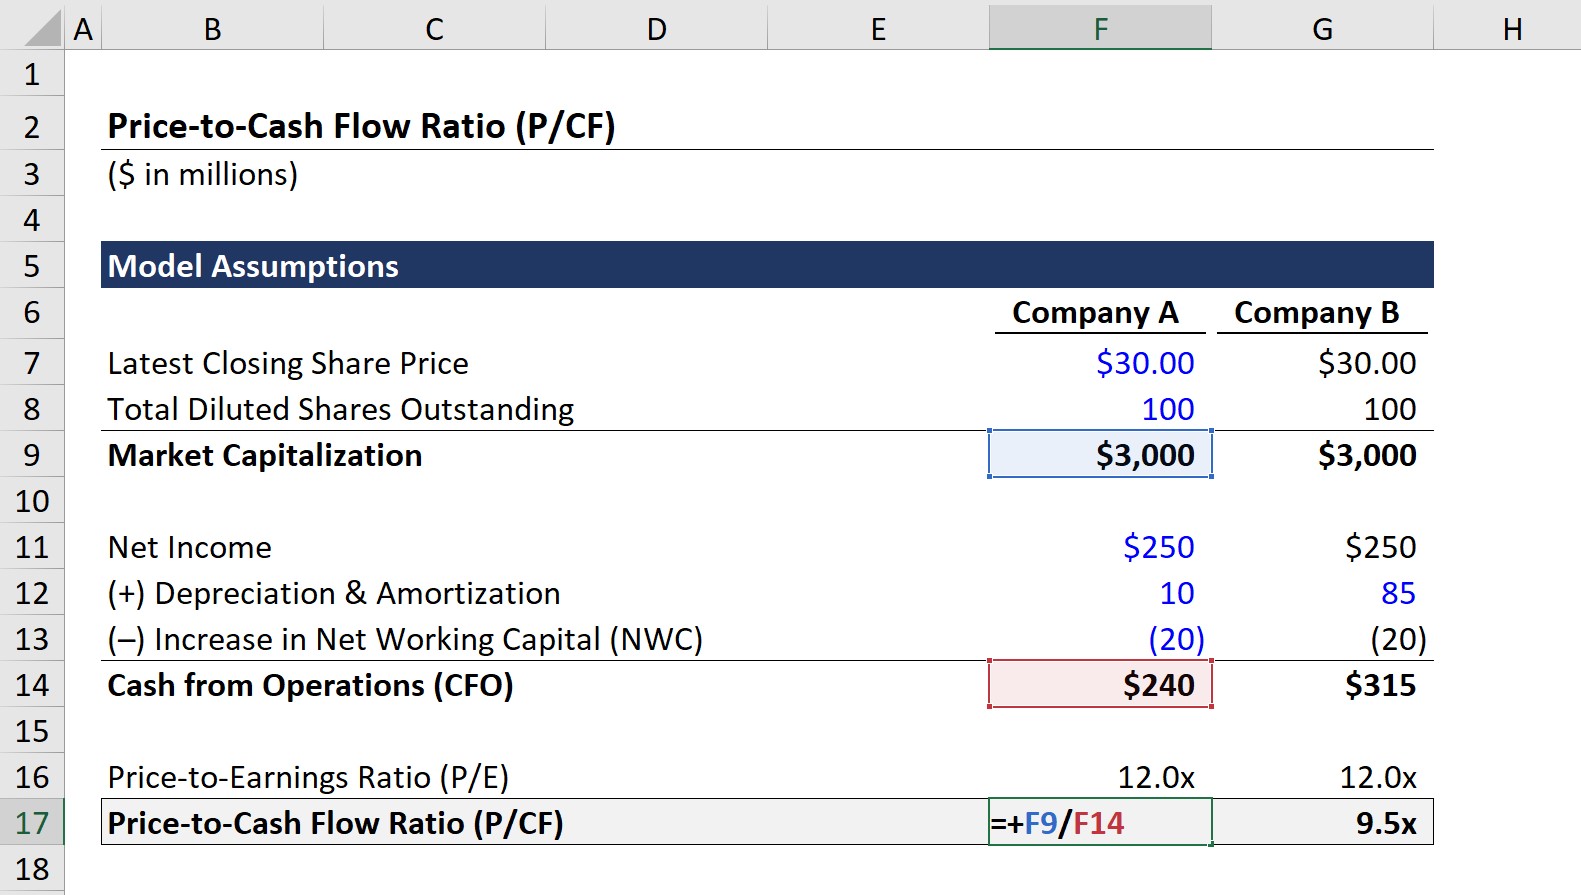
In our example scenario, we have two companies that we’ll refer to as “Company A” and “Company B”.
For both companies, we’ll be using the following financial assumptions:
- Latest Closing Share Price = $30.00
- Total Diluted Shares Outstanding = 100m
From those two assumptions, we can calculate the market capitalization of both companies by multiplying the share price and diluted share count.
- Market Capitalization = $30.00 × 100m = $3bn
As for the next step, we’ll calculate the denominator using the following operating assumptions:
- Net Income = $250m
- Depreciation & Amortization (D&A):
- Company A D&A = $250m
- Company B D&A = $85m
- Increase in Net Working Capital (NWC) = –$20m
Based on the stated assumptions above, the only difference between the two companies is the D&A amount ($250m vs $85m).
In effect, cash from operations (CFO) for Company A is equal to $240m while CFO is $315m for Company B.
2. Price to Cash Flow Calculation Example
At this point, we have the required data points to calculate the P/CF ratio.
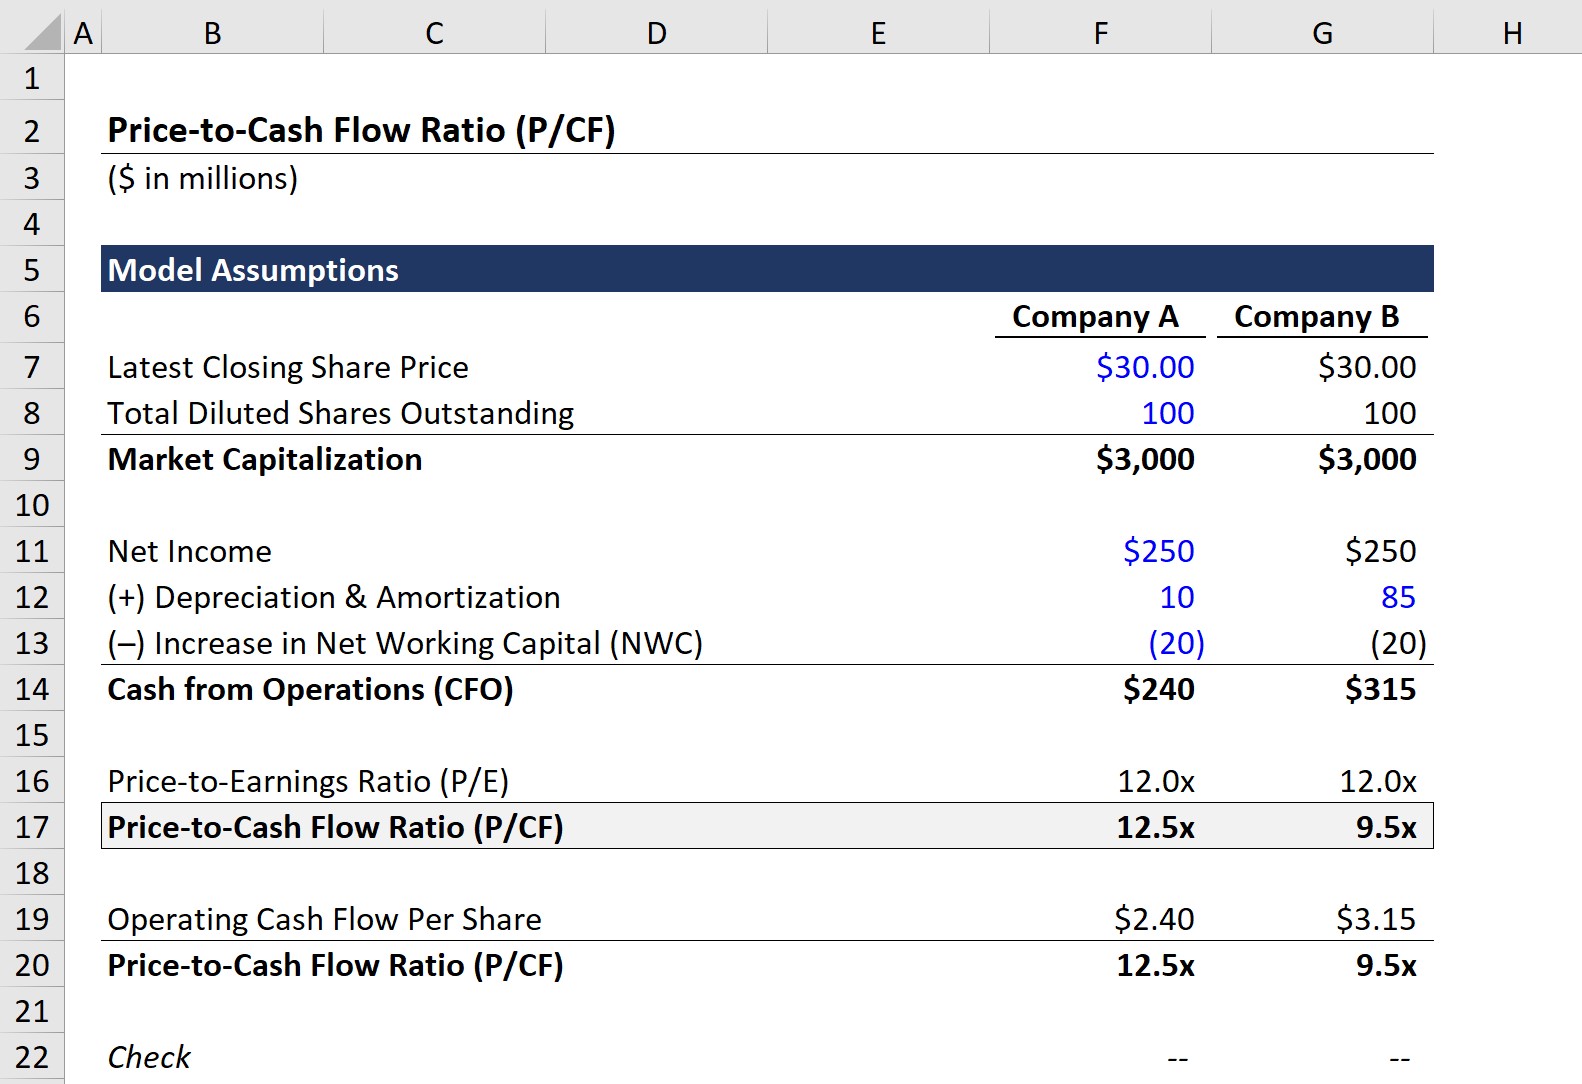
But to see the benefit of the P/CF ratio over the P/E ratio, we’ll first calculate the P/E ratio by dividing the market capitalization by net income.
-
Price to Earnings Ratio (P/E) = $3bn ÷ $250m = 12.0x
Then, we’ll calculate the P/CF ratio by dividing the market capitalization by cash from operations (CFO), as opposed to net income.
- Company A – Price-to-Cash Flow Ratio (P/CF) = $3bn ÷ $240m = 12.5x
- Company B – Price-to-Cash Flow Ratio (P/CF) = $3bn ÷ $315m = 9.5x
To confirm our calculation is done correctly, we can use the share price approach to check our P/CF ratios.
Upon dividing the latest closing share price by the operating cash flow per share, we get 12.5x and 9.5x for Company A and Company B once again.
For either company, the P/E ratio comes out to 12.0x, but the P/CF is 12.5x for Company A while being 9.5x for Company B.
The difference is caused by the non-cash add-back of depreciation and amortization (D&A).
In closing, the more the net income of a company varies from its cash from operations (CFO), the more insightful the price to cash flow (P/CF) ratio will be.

Everything You Need To Master Financial Modeling
Enroll in The Premium Package: Learn Financial Statement Modeling, DCF, M&A, LBO and Comps. The same training program used at top investment banks.
Enroll Today
")
")

