- What is Churn Rate?
- How to Calculate Churn Rate
- Churn Rate Formula
- Customer vs. Revenue Churn: What is the Difference?
- SaaS Churn Rate Calculation Example
- Churn Rate vs. Retention Rate: What is the Difference?
- How to Convert Monthly Churn to Annual Churn Rate
- How Does Churn Impact the LTV/CAC Ratio?
- How to Interpret Customer Churn Rate
- How to Reduce Churn Rate
- SaaS B2B vs. B2C Market: Customer Churn Analysis
- Monthly vs. Annual Churn: Average SaaS Industry Benchmark
- Is 5% an Acceptable Monthly Churn Rate?
- Churn Rate Calculator — Excel Template
- 1. Customer Churn and New Subscriber Assumptions
- 2. New vs. Churned Subscribers Forecast
- 3. SaaS Bottom-Up Revenue Build
What is Churn Rate?
The Churn Rate measures the percentage of a SaaS company’s existing customers that opted to cancel their subscriptions (and discontinue being a customer) across a specified time horizon.
In simple terms, the churn rate is a measure of the lost customers across a specified time frame.
The churn rate is calculated by dividing the churned customers by the total number of customers at the beginning of the period, expressed as a percentage.

- The churn rate is the rate at which a SaaS company lost customers or revenue within a stated period, usually on a monthly or annual basis.
- The churn rate measures the percentage of a company's existing customers that decided to cancel their subscriptions or discontinue being customers over a specified period.
- The churn rate is calculated by dividing the number of churned customers by the total number of customers at the beginning of the period.
- The churn of customers (and revenue) is critical to manage for the long-term viability of subscription-based and SaaS business models, because acquiring new customers is futile if unable to retain them.
- The churn rate is inversely related to the retention rate, which measures the percentage of customers that remain customers.
How to Calculate Churn Rate
The churn rate—or “attrition rate”—is the proportion of existing customers at the beginning of a period that was lost over a given period.
The churn rate answers the question, “Of the company’s total existing customers at the beginning of the period, what percentage of the customers were lost by the end of the period?”
Currently, the modern business model is oriented around recurring revenue and subscription-based pricing models, such as Spotify and Netflix.
In particular, the software-as-a-service (SaaS) model—in which companies provide cloud-based services on a subscription basis—is an integral part of practically all industries, either directly or indirectly.
Simply put, the long-term viability of SaaS companies depends not only on their capabilities in acquiring new customers but also on retaining them, which coincides with low churn rates.
The distinction from the traditional business model is that in the SaaS business model, a service is delivered on a multi-year basis, and customers make payments periodically, like a monthly subscription.
Calculating the customer churn rate is a four-step process:
- Step 1 ➝ Select Time Metric – e.g. Monthly, Weekly, Quarterly, Annual
- Step 2 ➝ Count the Number of Customers at Beginning of Period (BOP)
- Step 3 ➝ Determine Number of Churned Customers by End of Period (EOP)
- Step 4 ➝ Divide Churned Customers by Number of Customers at Beginning of Period (BOP)
Churn Rate Formula
The churn rate formula divides the number of lost customers by the total number of customers at the beginning of the period.
The numerator of the churn rate formula—the number of churned customers—can be calculated using the following formula:
In order to calculate the metric correctly, it is imperative to choose the period (e.g. quarterly, annual) and ensure consistency in all subsequent calculations, as well as explicitly state the period chosen.
Customer vs. Revenue Churn: What is the Difference?
There are two different methods of calculating the churn rate:
- Customer-Based Churn ➝ The customer churn measures the percentage of lost customers relative to the customer count at the beginning of the period.
- Revenue-Based Churn ➝ The revenue churn measures the recurring revenue (MRR, ARR) lost from churned customers and cancellations of a subscription service over a specified period.
SaaS Churn Rate Calculation Example
Suppose a SaaS company had 200 customers at the beginning of last year, and eight customers decided not to renew their contracts at the end of the year.
- Beginning Customers = 200 Customers
- Churned Customers = 8 Customers
The customer churn for the year is 4.0%, which we calculated by dividing the churned customers by the beginning customer count.
- Customer Churn = 8 Churned Customers ÷ 200 Beginning Customers = 4.0%%
Churn Rate vs. Retention Rate: What is the Difference?
Customer churn describes the users that sign up or subscribe and then later on cancel, whereas customer retention is the percentage of customers that remain customers.
The inverse of the churn rate is the retention rate, which reflects the proportion of customers that continue to use a certain product over a specified period.
Since churn and retention are inversely related, subtracting the retention rate from one will output the churn rate.
Both of the aforementioned KPIs—the churn rate and retention rate—are necessary to analyze customer behavior and perform churn analysis on spending trends.
On the subject of churn analysis, the most common (and recommended) approach is to perform cohort analysis, where the customer behavior analytics data is analyzed based on the shared traits among customers.
How to Convert Monthly Churn to Annual Churn Rate
The following table contains the conversion from monthly to annual churn rates, where the right column is the annual churn that correspoonds the the coinciding monthly churn on the left.
The formula to convert the monthly churn rate to an annual churn rate is equal to one subtracted by the monthly churn rate, raised to the 12th power, which is then subtracted from one.
| Monthly Churn Rate | Annual Churn Rate |
|---|---|
| 1.0% | 11.4% |
| 2.0% | 21.5% |
| 3.0% | 30.6% |
| 4.0% | 38.7% |
| 5.0% | 46.0% |
| 6.0% | 52.4% |
| 7.0% | 58.1% |
| 8.0% | 63.2% |
| 9.0% | 67.8% |
| 10.0% | 71.8% |
| 11.0% | 75.3% |
| 12.0% | 78.4% |
| 13.0% | 81.2% |
| 14.0% | 83.6% |
| 15.0% | 85.8% |
How Does Churn Impact the LTV/CAC Ratio?
The most informative insights can be retrieved by identifying the underlying drivers that are causing customers to churn (or remain a customer).
Customer retention is an integral component of a company’s business model, and its capacity to achieve long-term, sustainable growth, particularly for the SaaS industry.
While the churn rate often flags potential issues to fix, the retention rate offers insights into a company’s target end market (and customer profile).
Based on the information derived from analyzing the data set, a company should alter its business model as deemed necessary to not only maximize its recurring revenue, but to improve its customer lifetime value (LTV) to customer acquisition cost (CAC).
The LTV/CAC ratio is a fundamental KPI for SaaS and subscription-based companies that measures the value obtained from a customer on average relative to the cost of acquiring said customer.
For example, if a company’s retention rate is 60%, the implied churn rate is 40%.
- Customer Churn = 1 – 60% = 40%
- Retention Rate = 1 – 40% = 60%
The churn rate is an input used to estimate the customer lifetime – the approximate time the average customer will continue doing business with a company.
For example, if a company’s monthly churn rate is 2.0%, then the implied lifetime is 50 months.
- Customer Lifetime = 1 ÷ 2.0% = 50 Months
How to Interpret Customer Churn Rate
A recurring revenue stream can seem appealing to many – hence, there is a widespread shift toward recurring revenue as opposed to one-time sales.
The drawback to recurring revenue is the recurring responsibilities in terms of product quality and post-sale customer relationship management.
If customers are left unsatisfied, a source of income is cut off. Further, cancellations can also now be done over the phone or by email, making it easier than ever for unsatisfied customers to discontinue.
Even though SaaS companies—particularly in the earlier stages of their lifecycle—often prioritize sales and user growth in lieu of profitability, they must not neglect their existing acquired customer base.
In the long run, customer retention determines a company’s success (or failure), as acquiring countless customers is pointless if most end up abandoning the product/service soon after.
For a company with a high churn rate to continue operating, it must continually offset those lost customers by acquiring new customers, which is not a sustainable business model.
Cancellations can be categorized as either voluntary or involuntary.
- Voluntary Cancellation ➝ The customer actively terminates the subscription or denies renewal.
- Involuntary Cancellation ➝ The cause of a customer cancellation was a credit card decline (e.g. expiration, insufficient funds), network failure, or internal mistake.
How to Reduce Churn Rate
Churn is an unavoidable part of the normal course of business, but there are frequent mistakes that cause customers to leave their current provider.
- Market Competition ➝ A customer is at risk of switching if a competitor in the market offers a more attractive product/service (or the same value proposition at a lower price).
- Product Quality ➝ For recurring purchases, a certain level of quality is expected by the customers that, if not met, leads to more cancellations, especially if there are higher quality offerings out there.
- Substitute Offering ➝ An alternative offering could steal away customers if it is sufficient to meet customer needs and demands, even with fewer capabilities, as those customers may want to avoid paying a premium for unneeded features.
- Lack of Innovation ➝ Often, companies can become complacent after achieving a certain level of success, making them prone to disruption, i.e. new start-ups can sometimes offer more technical features with more modern marketing.
- Mispricing ➝ Setting pricing appropriately to balance maximizing revenue and casting a broad net to obtain customers is crucial for customer retention, i.e. pricing power vs. affordability.
- After-Sale Service ➝ Ensuring existing customers are satisfied is just as important – if not more important – than the initial onboarding of the customer, so routine check-ins and requests for feedback should be made (e.g. measuring the net promoter score)
The recurring theme to reduce churn rates is the necessity for adaptability with regard to product capabilities, innovation, pricing, and understanding of their customer’s needs.
Other methods to reduce churn include the following:
- Upselling + Cross-Selling ➝ Loyalty can be built by selling more products to the customer, in which the eventual switching costs could disincentivize a customer from leaving – plus, synergistic products can also be beneficial.
- Loyalty Rewards ➝ A company that rewards long-term customers can establish stronger brand loyalty (and potentially even a self-fulfilling prophecy in which customers stick with the company because they were treated well).
- Long-Term Pricing ➝ Instead of monthly subscriptions, securing a long-term commitment by offering an annual discount could increase retention.
- Engagement + Implementation ➝ Companies often send automated survey requests, but the most effective way to show that customers’ opinions are valued is to implement tangible changes.
The Wharton Online & Wall Street Prep Applied Value Investing Certificate Program
Learn how institutional investors identify high-potential undervalued stocks. Enrollment is open for the upcoming cohort.
Enroll TodaySaaS B2B vs. B2C Market: Customer Churn Analysis
B2B companies tend to experience lower churn rates relative to B2C companies.
- Niche Target Market ➝ B2B companies often target a specific market niche, so given the limited number of potential customers, these providers have closer relationships with their customers – whereas maintaining close relations with all customers is typically unfeasible on the B2C side.
- Higher AOV ➝ The average order value (AOV) is substantially higher for B2B companies (i.e. more cash to spend, higher technical requirements), thus fewer customers are needed to reach the same amount of revenue, making each relationship carry more weight.
- Customized Technical Offerings ➝ B2B products attempt to meet very specific customer needs and fix complex needs in an effort to become integrated into the customer’s operation. These specialized offerings are often customized even more post-sale, making customers even less likely to churn.
- Multi-Year Contracts ➝ Most B2B sales are structured as multi-year contracts instead of monthly as is common in B2C, i.e. B2B customers usually have more of a contractual obligation to remain a customer.
Monthly vs. Annual Churn: Average SaaS Industry Benchmark
According to venture capitalist, Tom Tunguz of Redpoint, the average churn rates in the SaaS industry are as follows:

The Innovator’s Dilemma for SaaS Startups (Source: Tom Tunguz)
There is one nuance, however, to our earlier statement about how a low churn tends to be a positive sign for early-stage companies.
Early adopters often comprise a large proportion of a start-up’s total customer base – and those customers are the least likely to churn – as most are more so passionate about learning about and testing the latest, most innovative technologies. In effect, the churn rate can be skewed by those early adopters that resemble “product testers” more than real customers.
Churn also has a clear correlation with the lifecycle of the company, i.e. the number of years it has been operating.
Typically, the highest churn rates are observed in the earliest phase of a company’s lifecycle.
As companies mature, the churn rate usually normalizes because at this stage, the company is typically run with greater efficiency and has a better understanding of its target market and customers. However, it is important to be aware of the survivorship bias that may be present in this observation.
Is 5% an Acceptable Monthly Churn Rate?
In SaaS, the “acceptable” churn rate is sometimes cited as 5%, which has been demonstrated by many startups.
However, a 5% churn could lead to a false sense of security, especially considering most startups still fail.
For an illustrative example of how unsustainable a 5% churn is, let’s run through a hypothetical example of a company with 100 users in January and a monthly churn of 5%.
By the end of December, the differential between the beginning and ending user count is a loss of 41 users at an implied annual churn of 43.1%.

Companies with 5% monthly churn rates can end up successful, but they are the exception and not the rule.
Churn Rate Calculator — Excel Template
We’ll now move to a modeling exercise, which you can access by filling out the form below.
1. Customer Churn and New Subscriber Assumptions
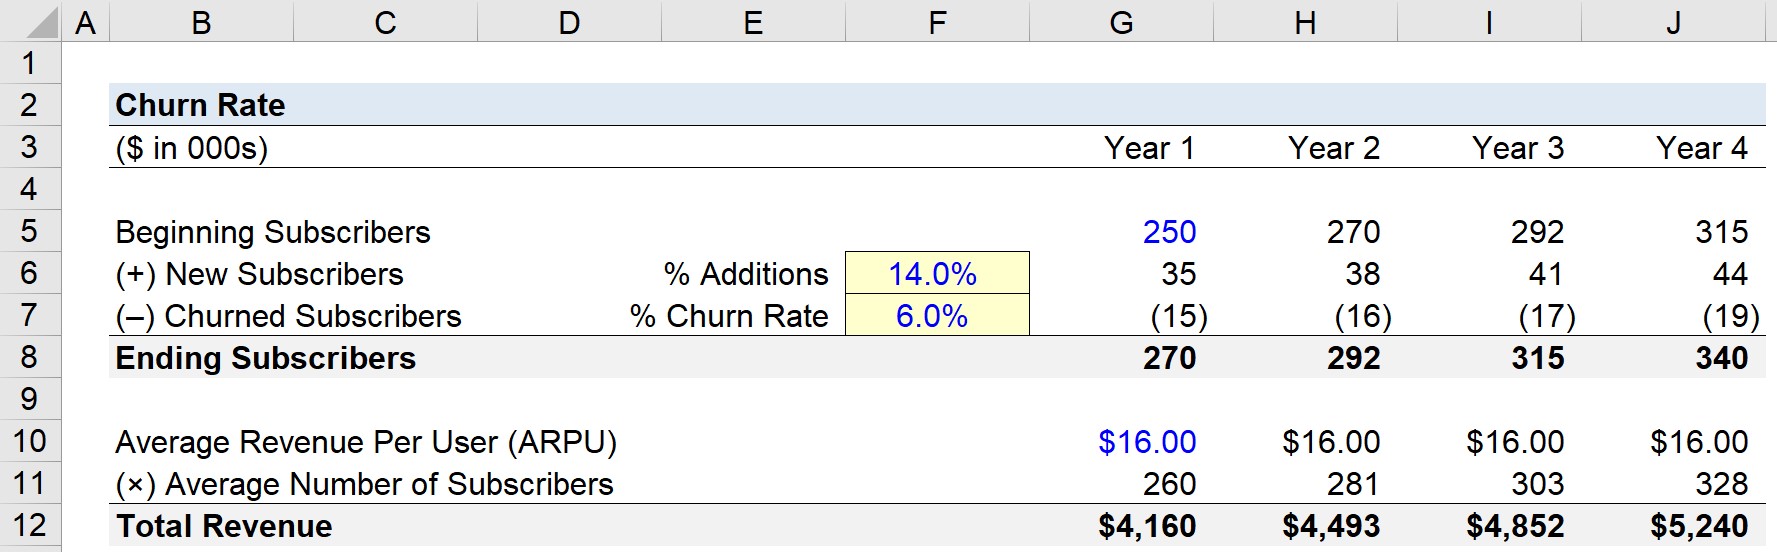
Suppose we are building a four-year revenue forecast for a SaaS company that sells a subscription-based product that customers pay for annually.
At the end of the latest fiscal year, the company had 250k subscribers, so that subscriber count will be the beginning balance in Year 1.
- Beginning Subscribers (Year 1) = 250,000
In order to project the number of customers, we’ll assume that the number of new subscriber additions will be 14% of the beginning subscriber count.
On the other hand, the assumption for the estimated churn rate will be 6.0% of the beginning count.
- New Subscriber Additions (% of Beginning) = 14.0%
- Churn Rate (% of Beginning) = 6.0%
2. New vs. Churned Subscribers Forecast
Using those assumptions, we can project the number of customers for each period by multiplying the annual new customer acquisition rate by the beginning customer count.
Next, the same process is done with the churn rate but with a negative sign placed in front since it represents a reduction in customers.
From Year 1 to the end of Year 4, the ending customer count increases from 270,000 to 340,000 subscribers.
3. SaaS Bottom-Up Revenue Build
We’ll use the estimated customer counts to project the SaaS company’s revenue in the next part.
The average revenue per user (ARPU) is assumed to be $16.00 per subscriber.
- Average Revenue Per User (ARPU) = $16.00
Moreover, we’ll average the beginning and ending subscriber counts to calculate the number of average subscribers for each year.
The average subscriber count is used here because subscribers churn throughout the year—but if we used the ending amounts instead, the implicit assumption is that all cancellations occur at the end of the year.
The projected revenue utilizes a standard “Price × Volume” formula, in which the price metric is the ARPU, and the quantity metric is the average subscribers.
Once performed for the entire forecast period, we arrive at the following revenue figures for our four-year forecast period.
- Total Revenue (Year 1) = $4.16 million
- Total Revenue (Year 2) = $4.49 million
- Total Revenue (Year 3) = $4.85 million
- Total Revenue (Year 4) = $5.24 million
From Year 1 to Year 4, the SaaS company’s revenue grew from $4.16 million to $5.24 million, with the underlying driver being the new customer acquisition rate outpacing the churn rate.