 Skip to main content
- What is Depreciation?
- How Depreciation Works in Accounting
- How to Calculate Depreciation Expense
- Depreciation Formula
- Illustrative Depreciation Calculation Example
- Is Depreciation an Operating Expense?
- How Does Depreciation Impact the Financial Statements?
- Straight-Line vs. Accelerated Depreciation: What is the Difference?
- How to Build a Depreciation Schedule
- How to Forecast Depreciation
- Depreciation Calculator
- 1. Fixed Asset Purchase Cost Assumptions
- 2. Excel Depreciation Waterfall Schedule Calculation
- 3. Depreciation Calculation Example
- 4. PP&E Roll-Forward Schedule Build
What is Depreciation?
Depreciation is a non-cash expense that allocates the purchase of fixed assets, or capital expenditures (Capex), over its estimated useful life.
The depreciation expense reduces the carrying value of a fixed asset (PP&E) recorded on a company’s balance sheet based on its useful life and salvage value assumption.
How Depreciation Works in Accounting
Conceptually, the depreciation expense in accounting refers to the gradual reduction in the recorded value of a fixed asset on the balance sheet from “wear and tear” with time.
The recognition of depreciation is mandatory under the accrual accounting reporting standards established by U.S. GAAP (FASB).
The core objective of the matching principle in accrual accounting is to recognize expenses in the same period as when the coinciding economic benefit was received.
Because a fixed asset (PP&E) is a long-term asset that provides benefits in excess of twelve months, the purchase of fixed assets – otherwise referred to as capital expenditures (Capex) – must be capitalized rather than expensed in the period incurred.
- Capitalize → The total cost is allocated across the useful life assumption of the fixed asset (i.e. PP&E) that will offer positive economic benefits for more than one year.
- Expense → The expense incurred is recognized on the income statement in the period in which the outflow occurred – for instance, the purchase of inventory is anticipated to cycle out within one year.
In theory, the decision to capitalize the fixed asset purchase – i.e. a capital expenditure (Capex) – rather than record the purchase as an expense in the current period is a more accurate representation of the operational performance of the company.
The capital expenditure and the associated cash outflow with the purchase of the fixed asset are recognized across the period wherein it is generating revenue, instead of recognizing the entire capital expenditure in a single period.
How to Calculate Depreciation Expense
The most common methods to calculate depreciation are the following:
- Straight-Line Depreciation Method
- Declining Declining Depreciation Method (DDB)
- Units of Production Depreciation Method
1. Straight Line Depreciation Method
The straight-line depreciation method gradually reduces the carrying balance of the fixed asset over its useful life.
- Purchase Price → The cost of acquiring the fixed asset (PP&E) on the original date of purchase.
- Salvage Value → The estimated value of the asset at the end of its useful life (“scrap value”)
- Useful Life → The estimated number of years in which the fixed asset is assumed to continue providing positive economic utility.
2. Double Declining Balance (DDB) Method
The double declining method (DDB) is a form of accelerated depreciation, where a greater proportion of the total depreciation expense is recognized in the initial stages.
3. Units of Production Method
The units of production method recognizes depreciation based on the perceived usage (“wear and tear”) of the fixed asset (PP&E).
While technically more “accurate”, at least in theory, the units of production method is the most tedious out of the three and requires a granular analysis (and per-unit tracking).
Depreciation Formula
The depreciation expense is scheduled over the number of years corresponding to the useful life of the respective fixed asset (PP&E).
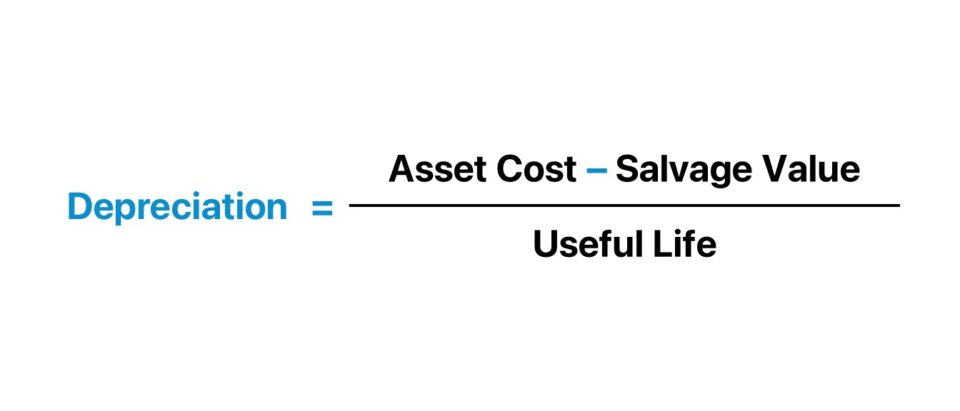
The formula to calculate the annual depreciation expense under the straight-line method subtracts the salvage value from the total PP&E cost and divides the depreciable base by the useful life assumption.
Where:
- Annual Depreciation Expense → The depreciation expense represents the allocation of the one-time cash outflow from a capital expenditure (Capex) throughout the useful life of the fixed asset – to decrease the value of the asset on the balance sheet as it helps produce revenue for the company.
- Salvage Value → The salvage value is defined as the value of the asset at the end of its useful life. Practically, salvage value can be thought of as the amount at which a company can sell the old asset at the end of its useful life.
- Useful Life → Once purchased, PP&E is a non-current asset that continues to provide benefits to the company for the duration of its useful life, which is an estimate of how long the asset will continue to be used and be of service to the company.
Illustrative Depreciation Calculation Example
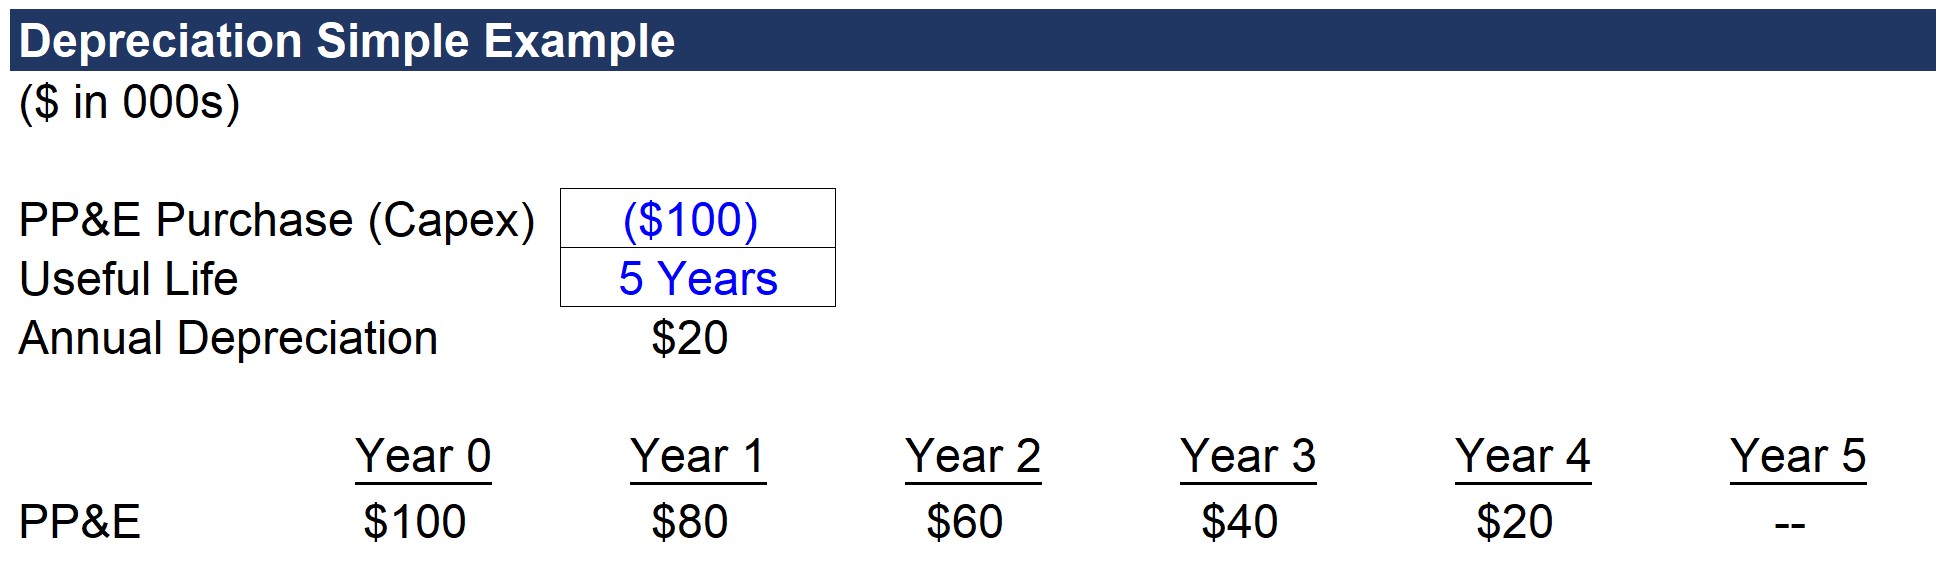
If a manufacturing company were to purchase $100k of PP&E with a useful life estimation of 5 years, then the depreciation expense would be $20k each year under straight-line depreciation.
Therefore, $100k in PP&E was purchased at the end of the initial period (Year 0) and the value of the purchased PP&E on the balance sheet decreases by $20k each year until it reaches zero by the end of its useful life (Year 5).
- PP&E Purchase Cost (Capex) = $100k
- Useful Life Assumption = 5 Years
- Salvage Value (Residual) = $0k
- Annual Depreciation = ($100k – $0k) ÷ 5 Years = $20k
Assuming the company pays for the PP&E in all cash, that $100k in cash is now out the door, no matter what, but the income statement will state otherwise to abide by accrual accounting standards.
In effect, this accounting treatment “smooths out” the company’s income statement so that rather than showing the $100k expense entirely this year, that outflow is effectively being spread out over 5 years as depreciation.
- Accumulated Depreciation = $20k × 5 Years = $100k
Is Depreciation an Operating Expense?
The depreciation expense, despite being a non-cash item, will be recognized and embedded within either the cost of goods sold (COGS) or the operating expenses line on the income statement.
The recognition of depreciation on the income statement thereby reduces taxable income (EBT), which leads to lower net income (i.e. the “bottom line”).
But while depreciation is recognized as an operating cost (i.e. COGS or Opex) on the income statement, the depreciation expense is subsequently treated as a non-cash add-back on the cash flow statement (CFS) since no real “outflow” of cash has occurred.
On the balance sheet, depreciation expense reduces the book value of a company’s property, plant and equipment (PP&E) over its estimated useful life.
Companies seldom report depreciation as a separate expense on their income statement. Thus, the cash flow statement (CFS) or footnotes section are recommended financial filings to obtain the precise value of a company’s depreciation expense.
How Does Depreciation Impact the Financial Statements?
The concept of depreciation is an important consideration in understanding the true cash flow profile of a company since it is a non-cash expense and can often be affected by discretionary assumptions by the company (i.e. determining the useful life).
- Non-Cash Item → The depreciation expense is added back on the cash flow statement (CFS) as it is a non-cash expense – this means that there was no actual cash outflow despite depreciation being classified as an expense on the income statement and reducing earnings.
- Tax Shield → While depreciation is treated as a non-cash expense and added back to the cash flow statement, the expense reduces the tax burden for the period since it is tax-deductible.
- Net Income → The recognition of depreciation on the income statement results in some “noise” when evaluating the net income as recorded on the income statement and this is why the cash flow statement is also necessary to evaluate a company’s performance.
Quickly, to ensure you understand the non-cash features of depreciation, we will go through the following classic accounting interview question, “How would a $10 increase in depreciation impact the three financial statements?”
- Income Statement → If depreciation increases by $10, operating income (EBIT) would decrease by $10. Assuming a 30% tax rate, net income would decline by $7.
- Cash Flow Statement → At the top of the cash flow statement, net income is down by $7, but recall the $10 depreciation is a non-cash expense and therefore added back. The net impact on the ending cash balance is a $3 increase, which comes from the tax-deductibility of depreciation (i.e., the $10 in depreciation x 30% tax rate).
- Balance Sheet → PP&E will decrease by $10 from the depreciation, while cash will be up by $3 on the assets side. On the liabilities and equity side, the $7 reduction in net income flows through to retained earnings. The balance sheet remains balanced since both sides went down by $7.
In closing, the key takeaway is that depreciation, despite being a non-cash expense, reduces taxable income and has a positive impact on the ending cash balance.
Straight-Line vs. Accelerated Depreciation: What is the Difference?
There are various depreciation methodologies, but the two most common types are straight-line depreciation and accelerated depreciation.
- Straight-Line Depreciation → Under the straight-line method of depreciation, the carrying value of PP&E on the balance sheet is decreased evenly per year until the residual value has diminished to zero. The majority of companies use a salvage value assumption in which the remaining value of the asset becomes zero by the end of its useful life. In doing so, the depreciation expense each year will be higher, and the depreciation tax benefits are fully realized if the salvage value is assumed to be zero (and this is the common assumption used in straight-line depreciation).
- Accelerated Depreciation → On the other hand, accelerated depreciation methods reduce the carrying balance of a fixed asset more in earlier periods (i.e. “front-loaded”). In turn, net income is reduced more in the initial years compared to later years. However, considering publicly traded companies tend to be short-term oriented concerning their reported net income and earnings per share (EPS) figures – most opt for straight-line depreciation.
At the end of the day, the cumulative depreciation amount is the same, as is the timing of the actual cash outflow, but the difference lies in net income and EPS impact for reporting purposes.
But in practice, most companies prefer straight-line depreciation for GAAP reporting purposes because lower depreciation will be recorded in the earlier years of the asset’s useful life than under accelerated depreciation.
Therefore, companies using straight-line depreciation will show higher net income and EPS in the initial years.
Under the accelerated depreciation method, net income and EPS would be lower in the earlier periods and then be higher relative to straight-line depreciation in later years – however, companies tend to prioritize near-term earnings performance.
The assumption behind accelerated depreciation is that the fixed asset drops more of its value in the earlier stages of its lifecycle, allowing for more deductions earlier on.
The accelerated approach eventually begins to show less depreciation on the income statement further into the asset’s useful life but to reiterate, companies still prefer straight-line depreciation because of the timing (i.e., avoid missing EPS figures on earnings releases).
How to Build a Depreciation Schedule
The depreciation expense can be projected by building a PP&E roll-forward schedule based on the company’s existing PP&E and incremental PP&E purchases.
The average remaining useful life for existing PP&E and useful life assumptions by management (or a rough approximation) are necessary variables for projecting new Capex.
While more technical and complex, the waterfall approach seldom yields a substantially differing result compared to projecting Capex as a percentage of revenue and depreciation as a percentage of Capex.
For a complete depreciation waterfall schedule to be put together, more data from the company would be required to track the PP&E currently in use and the remaining useful life of each. Additionally, management plans for future capex spending and the approximate useful life assumptions for each new purchase are necessary.
If the data is readily accessible (e.g., a portfolio company of a private equity firm), then this granular approach would be feasible, as well as be more informative than the simple percentage-based projection approach.
But in the absence of such data, the number of assumptions required based on approximations rather than internal company information makes the method ultimately less credible.
How to Forecast Depreciation
In terms of forecasting depreciation in financial modeling, the “quick and dirty” method to project capital expenditures (Capex) and depreciation are the following.
- Capital Expenditure → Capex % of Revenue
- Depreciation → Annual Depreciation % of Capex
Capital expenditures are directly tied to “top line” revenue growth – and depreciation is the reduction of the PP&E purchase value (i.e., expensing of Capex).
Capex can be forecasted as a percentage of revenue using historical data as a reference point. In addition to following historical trends, management guidance and industry averages should also be referenced as a guide for forecasting Capex.
In turn, depreciation can be projected as a percentage of Capex (or as a percentage of revenue, with depreciation as an % of Capex calculated separately as a sanity check).
For mature businesses experiencing low, stagnating, or declining growth, the depreciation to capex ratio converges near 100%, as the majority of total Capex is related to maintenance Capex.
- Growth Capex → Companies experiencing high growth usually will have capex as a relatively greater percentage of their revenues. In short, the more a company has spent on Capex in recent years, the more depreciation the company incurs in its near-term future. High-growth companies tend to spend heavily on growth capex (i.e., optional expenditures to fund growth and expansion plans), and therefore usually exhibit depreciation-capex ratios that far exceed 100%.
- Maintenance Capex → On the other hand, the capex of low-growth companies will consist of a smaller percentage of revenue, with most of it being maintenance capex, which refers to the routine spending required for operations to continue (e.g., to replace equipment, perform refurbishments). But if the company is still continuously purchasing fixed assets, it should require more time for the depreciation/Capex ratio to converge closer to 100% (i.e., until capex spending is scaled back).
Depreciation Calculator
We’ll now move on to a modeling exercise, which you can access by filling out the form below.
1. Fixed Asset Purchase Cost Assumptions
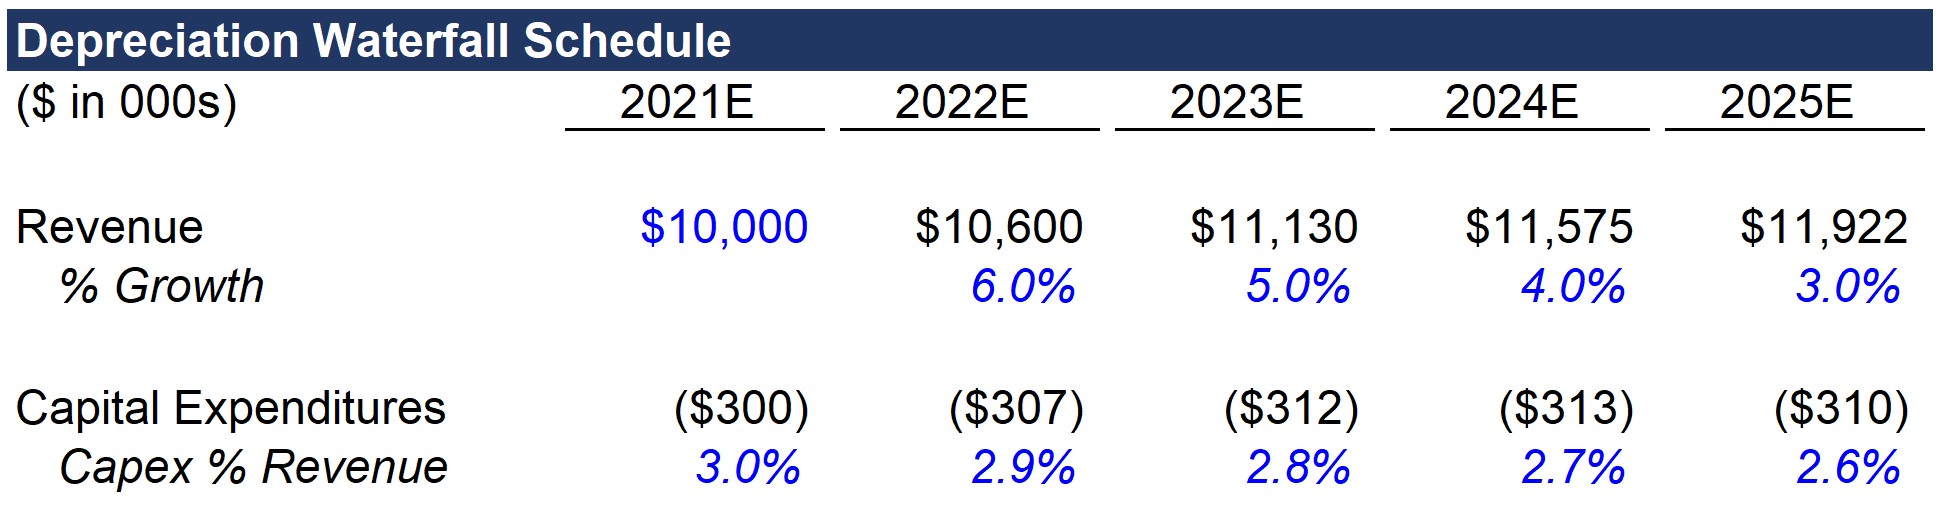
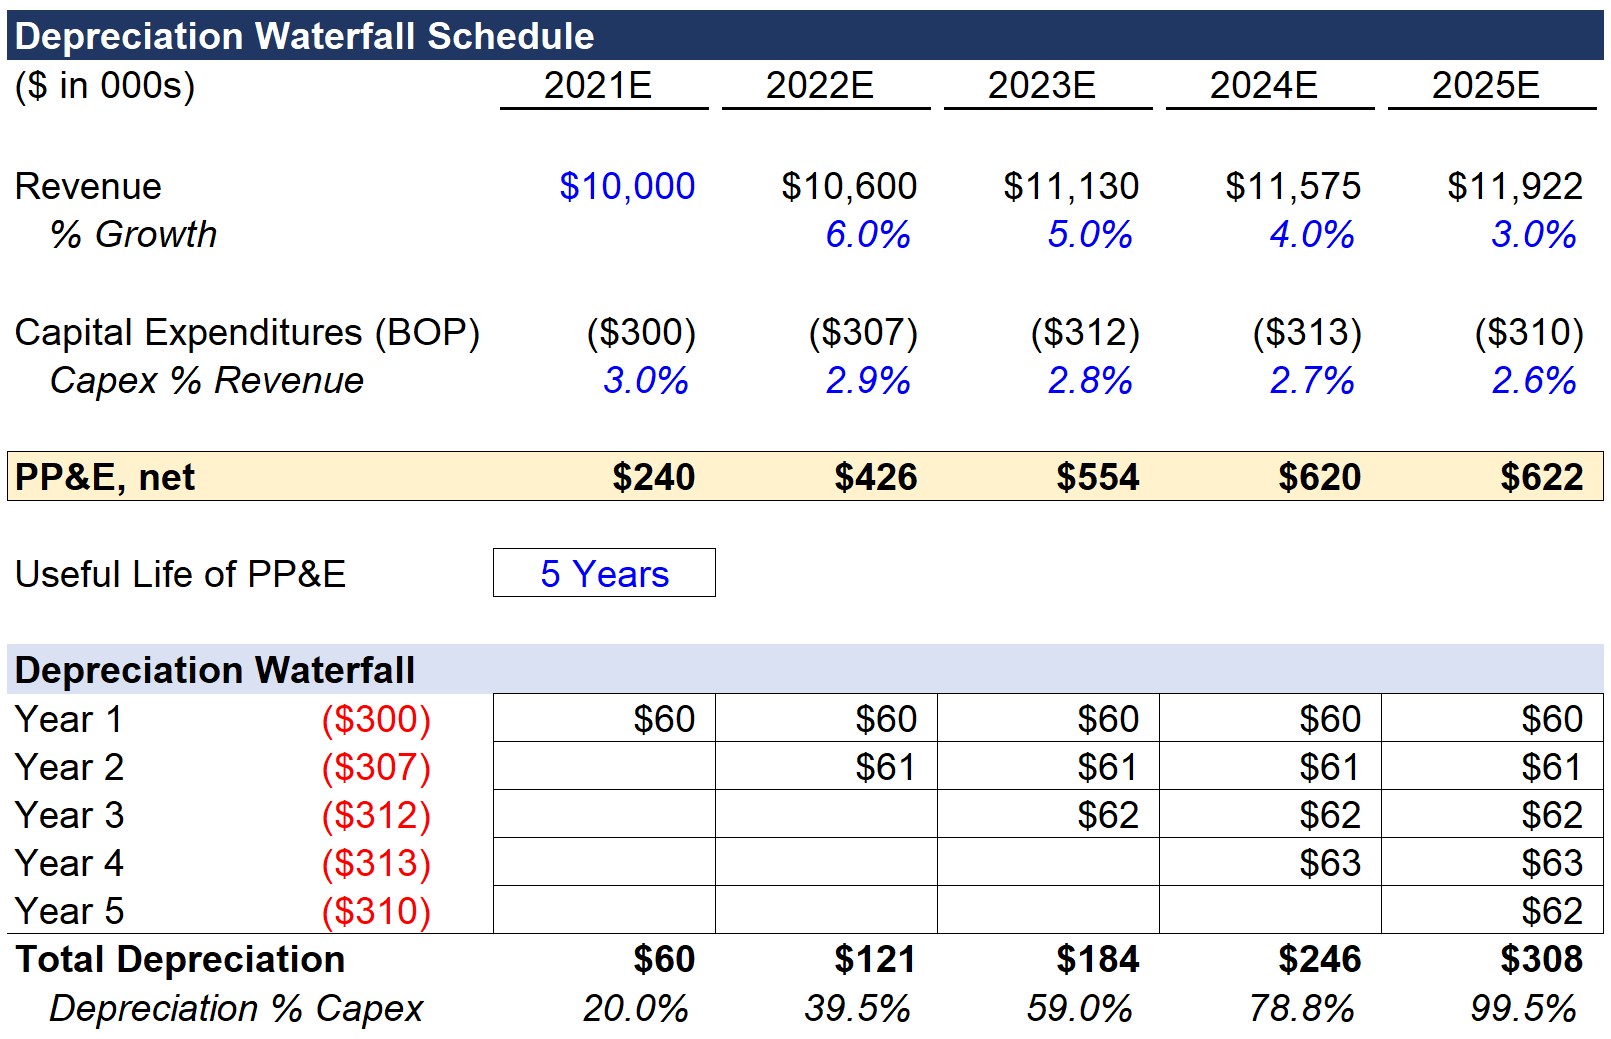
In our hypothetical scenario, the company is projected to have $10mm in revenue in the first year of the forecast, 2021. The revenue growth rate will decrease by 1.0% each year until reaching 3.0% in 2025.
- Revenue, 2021E = $10.0 million
- Revenue, 2022E = $10.6 million (6.0% YoY)
- Revenue, 2023E = $11.1 million (5.0% YoY)
- Revenue, 2024E = $11.6 million (4.0% YoY)
- Revenue, 2025E = $11.9 million (3.0% YoY)
Capex as a percentage of revenue is 3.0% in 2021 and will subsequently decrease by 0.1% each year as the company continues to mature and growth decreases. By 2025, Capex as a percentage of revenue will be 2.6%.
- Capex, 2021E = $300k (3.0% of Revenue)
- Capex, 2022E = $307k (2.9% of Revenue)
- Capex, 2023E = $312k (2.8% of Revenue)
- Capex, 2024E = $313k (2.7% of Revenue)
- Capex, 2025E = $310k (2.6% of Revenue)
Note that for purposes of simplicity, we are only projecting the incremental new capex.
In a full depreciation schedule, the depreciation for old PP&E and new PP&E would need to be separated and added together.
2. Excel Depreciation Waterfall Schedule Calculation
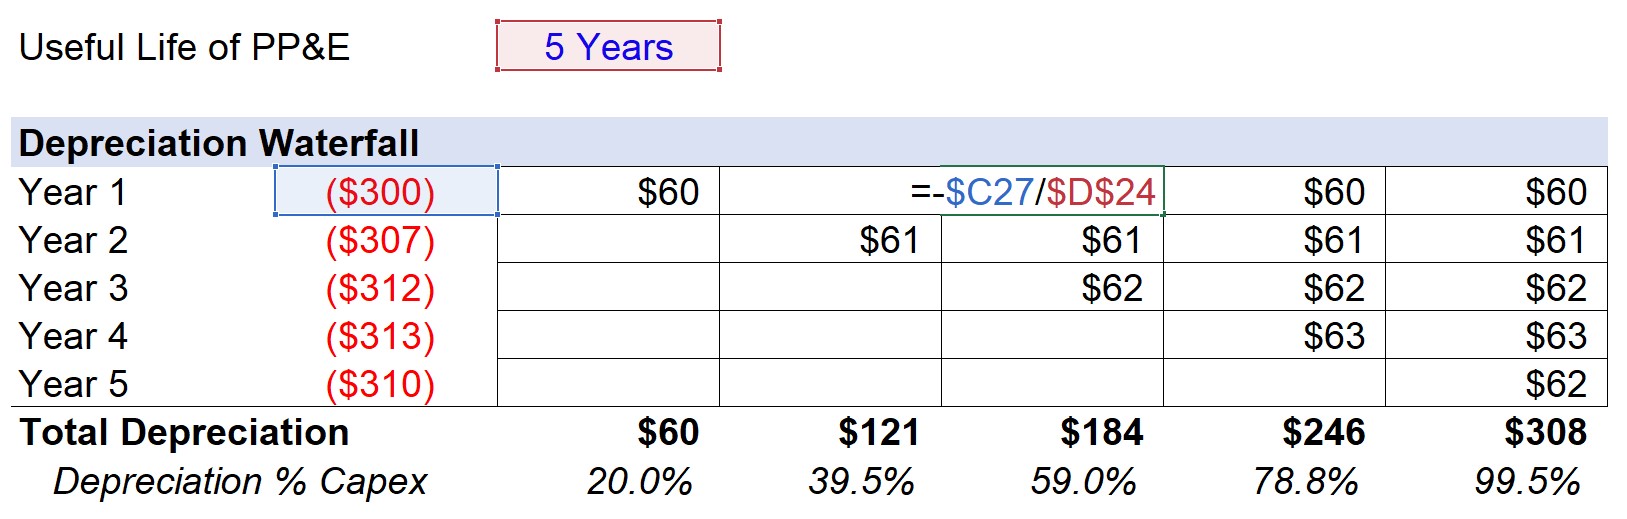
For the depreciation schedule, we will use the “OFFSET” function in Excel to grab the Capex figures for each year.
While not overly useful for our simplistic model, it can help conserve time in more complex builds at the per-asset level. Regarding the inputs for the formula:
- The first input is the reference cell, which is the cell to the left of the Capex amount
- Next, zero is entered for the row since we want to remain on Line 19
- Lastly, we link to the “Year X” cell on the left for the column input
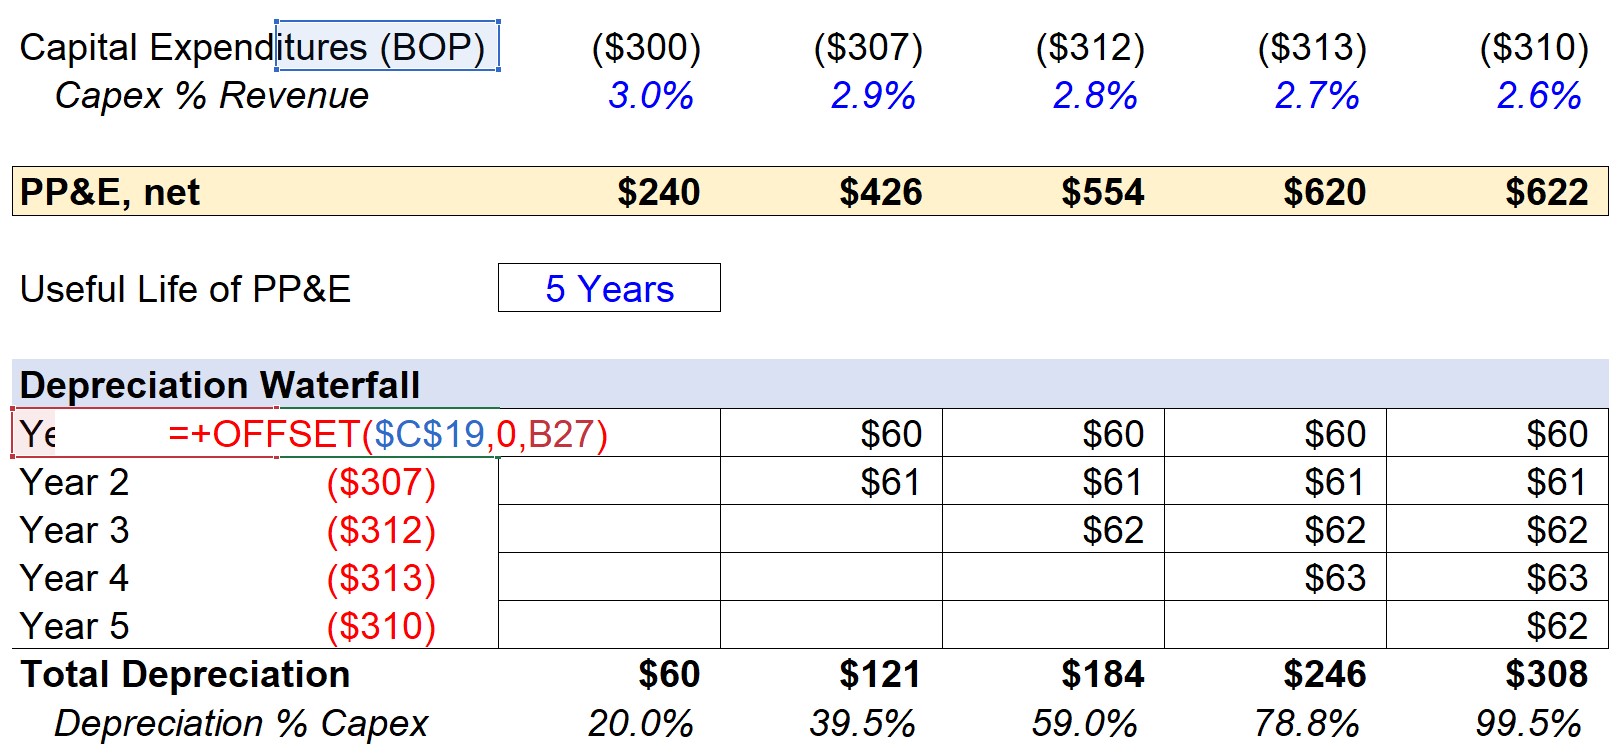
In the first year, the PP&E balance in 2021 comes from the $300k corresponding Capex spend.
- Capital Expenditures = $300k
- Useful Life of PP&E = 5 Years
Here, we are assuming the Capex outflow is right at the beginning of the period (BOP) – and thus, the 2021 depreciation is $300k in Capex divided by the 5-year useful life assumption.
- Depreciation, 2021E = $300k ÷ 5 Years = $60k
The depreciation expense comes out to $60k per year, which will remain constant until the salvage value reaches zero.
3. Depreciation Calculation Example
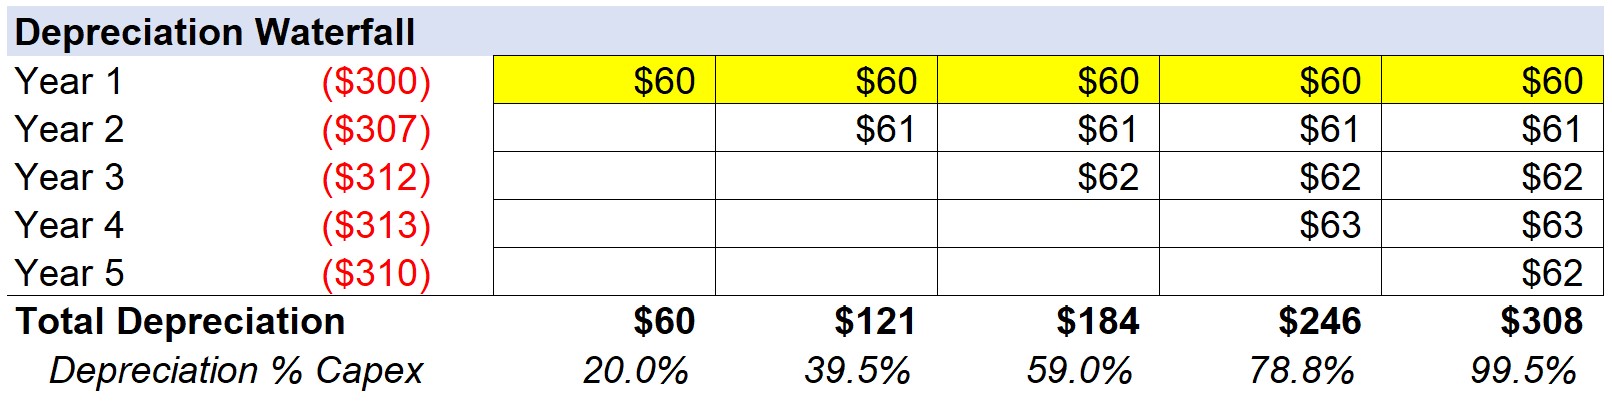
The formula to calculate the annual depreciation is the remaining book value of the fixed asset recorded on the balance sheet divided by the useful life assumption.
The completed forecast for Year 1 has been highlighted in the screenshot below.
As a quick sanity check, each of the numbers should be the same since we are using the straight-line approach in our example.
Note: While not applicable to our forecast model, longer-term projection models should use the “MAX” function in Excel with the remaining salvage value to make sure it does not dip below zero.
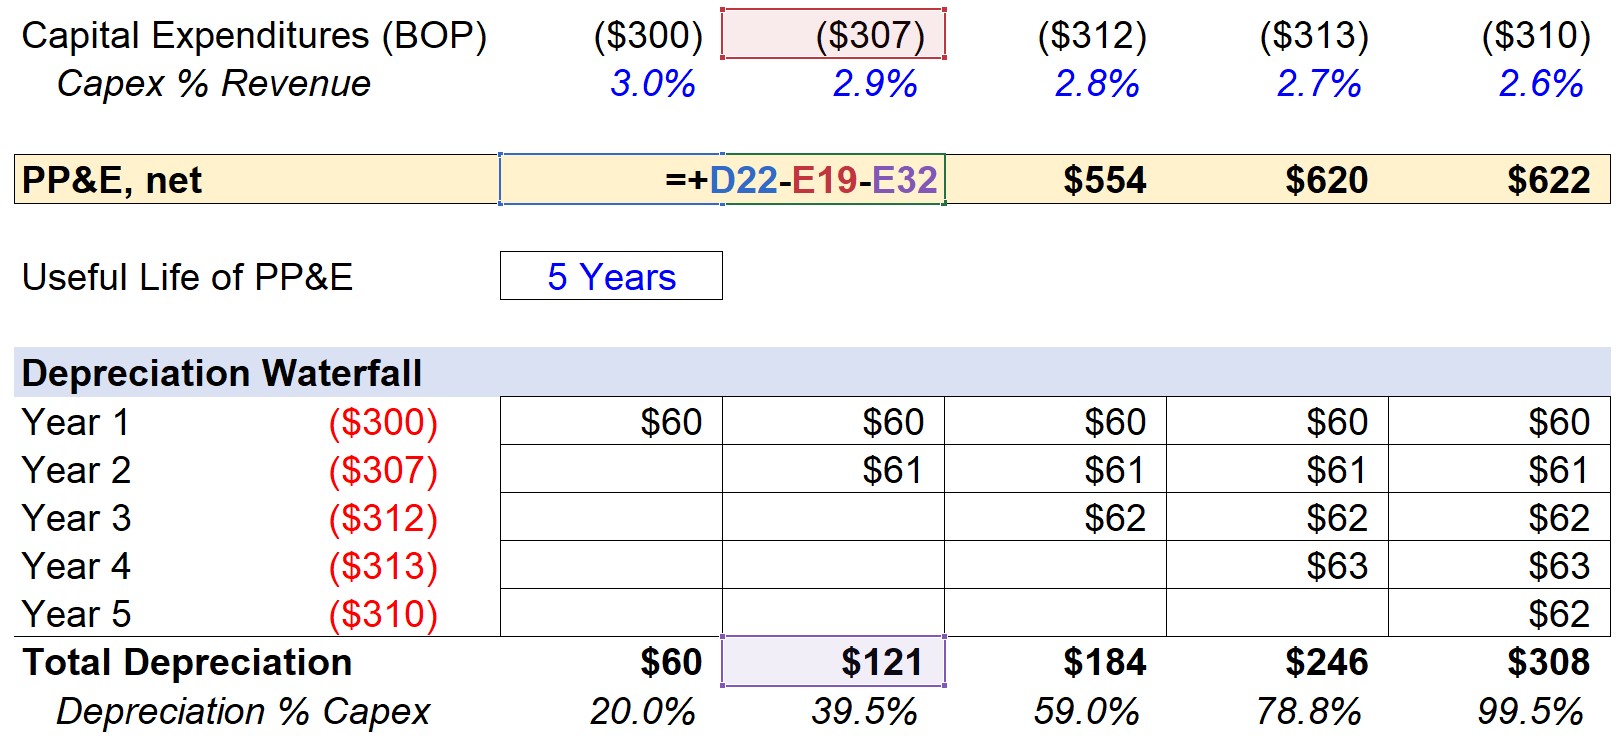
Then, we can extend this formula and methodology for the remainder of the forecast. For 2022, the new Capex is $307k, which after dividing by 5 years, comes out to be about $61k in annual depreciation.
Once repeated for all five years, the “Total Depreciation” line item sums up the depreciation amount for the current year and all previous periods to date.
For example, the total depreciation for 2023 is comprised of $60k of depreciation from Year 1, $61k of depreciation from Year 2, and then $62k of depreciation from Year 3 – which comes out to $184k in total.
Returning to the “PP&E, net” line item, the formula is the prior year’s PP&E balance, less Capex, and less depreciation.
Since Capex was input as a negative, the Capex will increase the PP&E amount as intended (otherwise, the formula would have added Capex if the positive sign convention had been used).
4. PP&E Roll-Forward Schedule Build
In closing, the net PP&E balance for each period is shown below in the finished model output.
- PP&E, net, 2021E = $240k
- PP&E, net, 2022E = $426k
- PP&E, net, 2023E = $554k
- PP&E, net, 2024E = $620k
- PP&E, net, 2025E = $622k
From our modeling tutorial, our hypothetical scenario shows the method by which depreciation, PP&E, and Capex can be forecasted, and illustrates just how intertwined the three metrics ultimately are.

Everything You Need To Master Financial Modeling
Enroll in The Premium Package: Learn Financial Statement Modeling, DCF, M&A, LBO and Comps. The same training program used at top investment banks.
Enroll Today


