
- What is Capital Expenditure?
- How Does a Capital Expenditure Work?
- Capex vs. Opex: What’s the Difference?
- What are Examples of Capital Expenditure?
- How to Calculate Capex
- Capex Formula
- Maintenance Capex vs. Growth Capex
- What is a Good Capex Ratio?
- How Do Capital Expenditures Impact the Financial Statements?
- Capex Calculator (Excel Template)
What is Capital Expenditure?
Capital Expenditure (Capex) refers to a company’s long-term investments in fixed assets (PP&E) to facilitate growth in the foreseeable future.
Like the change in net working capital (NWC), Capex – short for “Capital Expenditure” or “Capital Expense” – is classified as a reinvestment activity.
For the vast majority of companies, Capex is one of the most significant outflows of cash that can have a major impact on free cash flow (FCF).
- Capital expenditure, an abbreviation for “Capex”, is the purchase of long-term, tangible assets (PP&E), such as property, buildings, technology, and equipment.
- The accounting treatment of Capex is different from operating expenses (OpEx) because the acquired tangible assets provide long-term value, in excess of one year (>12 months).
- The two types of capital expenditures are maintenance Capex and growth Capex.
- Capex is not recognized as an expense on the income statement, but rather, the cash outflow is expensed via depreciation.
- The full cash outflow incurred from Capex is recognized in the cash from investing activities (CFI) section of the cash flow statement (CFS) in the period when the actual purchase occurred.
How Does a Capital Expenditure Work?
Capital expenditure, often abbreviated as “Capex,” describes the funds spent by a company to acquire, upgrade, and maintain physical fixed assets, such as property, buildings, and equipment.
For example, the act of repairing a roof, building a new factory, or purchasing a piece of equipment would each be categorized as a capital expenditure.
- Capital Expenditure (Capex) → Capex is distinct from an operating expense (Opex) because the underlying asset – i.e. the fixed asset associated with the capital spending – is expected to generate long-term benefits in excess of 12 months.
- Operating Expenses (Opex) → In contrast, operating expenses refer to the indirect costs incurred in the ordinary course of business, such as selling, general, and administrative (SG&A) expenses.
With regard to the proper accounting methodology, capital expenditures (Capex) must be depreciated – i.e. “spread out” – across the useful life of the fixed asset (PP&E) rather than being recognized in the year of actual incurrence.
The rationale for gradually reducing the fixed asset (PP&E) balance via depreciation – a non-cash expense recognized on the income statement – is intended to align the cost with the revenue generated, i.e. the “matching principle.”
Capex vs. Opex: What’s the Difference?
The difference between capital expenditure (Capex) and operating expenses (Opex) is as follows.
- Capital Expenditure (Capex) → Capital expenditure refers to the purchase of a fixed asset (i.e. useful life assumption that exceeds 12 months) expected to provide long-term economic benefits. On the income statement, capex is capitalized and then expensed.
- Operating Expense (Opex): On the other hand, operating expenses (Opex), such as costs incurred from sales, marketing, or general day-to-day business operations, do not provide economic benefits over the long term (>12 months). The benefits are instead near-term, which is why companies must continuously budget and allocate the spend, as opposed to periodic large outflows of cash.
What are Examples of Capital Expenditure?
Capital expenditures (Capex) include the purchase of new fixed assets and repairing or upgrading existing long-term assets, such as the following examples:
- Property ➝ Buildings, Land, Offices
- Equipment ➝ Transportation Vehicles, Machinery, Office Desks, Chairs
- Hardware ➝ Computers, Laptops, Phones
- Software ➝ CRM, ERP, Cybersecurity, Infrastructure
How to Calculate Capex
The capital expenditure (Capex) of a company in a given period can be determined by tracking the changes in the company’s fixed assets (or PP&E) balances recorded on the balance sheet, along with the current period’s depreciation expense from the income statement.
However, a separate line item for the depreciation expense is seldom found on the income statement.
Therefore, the depreciation expense should be obtained from the cash flow statement (CFS), where it is treated as a non-cash add-back.
If deprecation is consolidated with amortization, simply copy the D&A amount in the filing and use the search function to find the footnotes that break out the precise depreciation expense amounts.
To calculate capital expenditure (Capex), subtract the current period PP&E from the prior period PP&E and then add depreciation.
The reason that depreciation is added back is attributable to the fact that depreciation is a non-cash item.
Because of the guidelines set by accrual accounting reporting standards, depreciation expense must be recognized on the income statement (and usually embedded within COGS and Opex).
While depreciation expense reduces the carrying value of fixed assets (PP&E) on the balance sheet, there is no actual cash outlay.
Hence, the depreciation expense is treated as an add-back in the cash from operations (CFO) section of the cash flow statement (CFS) to reflect that no real cash outlay occurred.
Capex Formula
The current period PP&E can be calculated by taking the prior period PP&E, adding capital expenditure (Capex), and subtracting depreciation.
If the formula is rearranged to solve for capital expenditure (Capex), the value of a company’s capex for a given period can be determined.
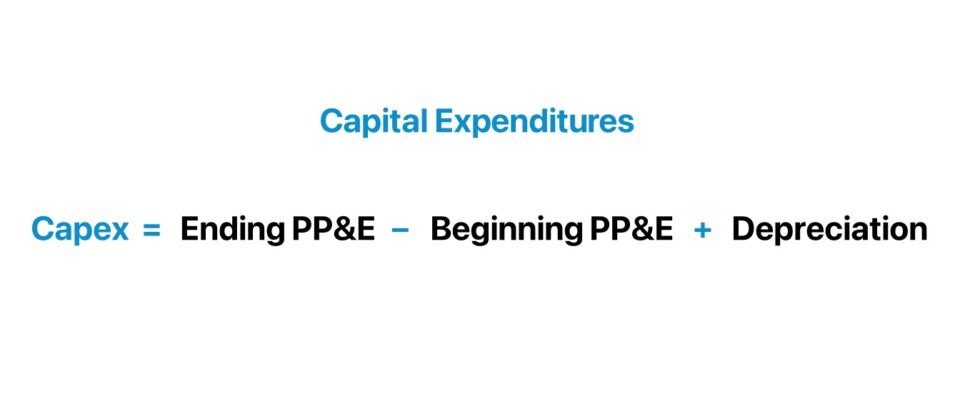
The capex formula subtracts the ending PP&E by the beginning PP&E balance, and then adds depreciation.
Where:
- Ending PP&E → Current Period PP&E Balance, i.e. End of Period (EoP)
- Beginning PP&E → Prior Period PP&E Balance, i.e. Beginning of Period (BoP)
- Depreciation → (Total PP&E Cost – Salvage Value) ÷ Useful Life Assumption
Therefore, the prior year’s PP&E balance is deducted from the current year’s PP&E balance.
Why? The difference between the prior and current period PP&E represents the change in PP&E.
Since the increase or decrease in PP&E reflects the Capex spend, the annual depreciation recognized in the same period is added back because the expense is a non-cash item.
Maintenance Capex vs. Growth Capex
There are two different types of classifications that capital expenditure (Capex) is categorized into:
- Maintenance Capital Expenditure (Capex) ➝ The required ongoing expenditures of a company to continue operating in its current state (e.g., repair of broken equipment, periodic system updates). Maintenance Capex involves mandatory spending to continue operations and is considered to be the spending associated with sustaining the current level of revenue and profit levels. If not replenished, ongoing operations wouldn’t be able to continue, which would negatively impact its performance.
- Growth Capital Expenditure (Capex) ➝ On the other hand, growth Capex is the discretionary spending of a company related to new growth strategic plans to acquire more customers and increase geographic reach. Growth Capex is when a company undertakes discretionary investments to increase its revenue and profits beyond historical levels, which usually entails grabbing more market share, geographic expansion, introducing new product lines, etc.
What is a Good Capex Ratio?
Growth capital expenditures and revenue growth are closely tied, as along with working capital requirements, capex is grouped together as “reinvestments” that help drive growth.
Hence, if growth capex is expected to decline and the percentage of maintenance capex increases, the company’s revenue should decrease from the reduction in reinvesting.
Barring unusual circumstances, it would be unreasonable over long-term time horizons for revenue growth to sustain itself (or increase) if the allocation of resources towards reinvestments has been decreasing.
The trend in the growth of capex must match revenue growth for projections to be reasonable.
As a company reaches maturity and the growth rate slows down to a sustainable rate (i.e., the company can grow at this rate perpetually), the ratio between depreciation and capex should converge towards 100%.
The convergence over time is attributable to how the majority of the spending becomes comprised of maintenance capex in tandem with the gradual diminishing of growth opportunities at some point in the lifecycle of the company.
Once a company’s growth begins to stagnate noticeably, a higher proportion of its total capex spend should shift toward maintenance capex.
In periods of economic expansion, the percentage of growth capex also tends to increase across most industries (and the reverse is true during periods of economic contraction).
How Do Capital Expenditures Impact the Financial Statements?
In terms of building a complete 3-statement financial model, taking the time to assess historical capital expenditure levels properly and projecting future capex accordingly is a critical step.
- Income Statement (I/S) → In order to match the expenses with the associated revenues during the same period, the value of the acquired PP&E is expensed via depreciation on the income statement as opposed to being treated as a one-time, immediate cash outflow on the date incurred. The expenditure is thus spread across the asset’s useful life, which is an estimate of how long the asset is considered to be “useful” and capable of producing economic benefits.
- Cash Flow Statement (CFS) → The actual full cash outflow related to capex is captured in the cash from investing section of the cash flow statement.
- Balance Sheet (B/S) → On the assets section of the balance sheet, the capex amount will be captured as an increase to the PP&E balance and will be reduced by the non-cash depreciation expense.
Capex Calculator (Excel Template)
We’ll now move on to a modeling exercise, which you can access by filling out the form below.
1. Revenue Growth Assumptions
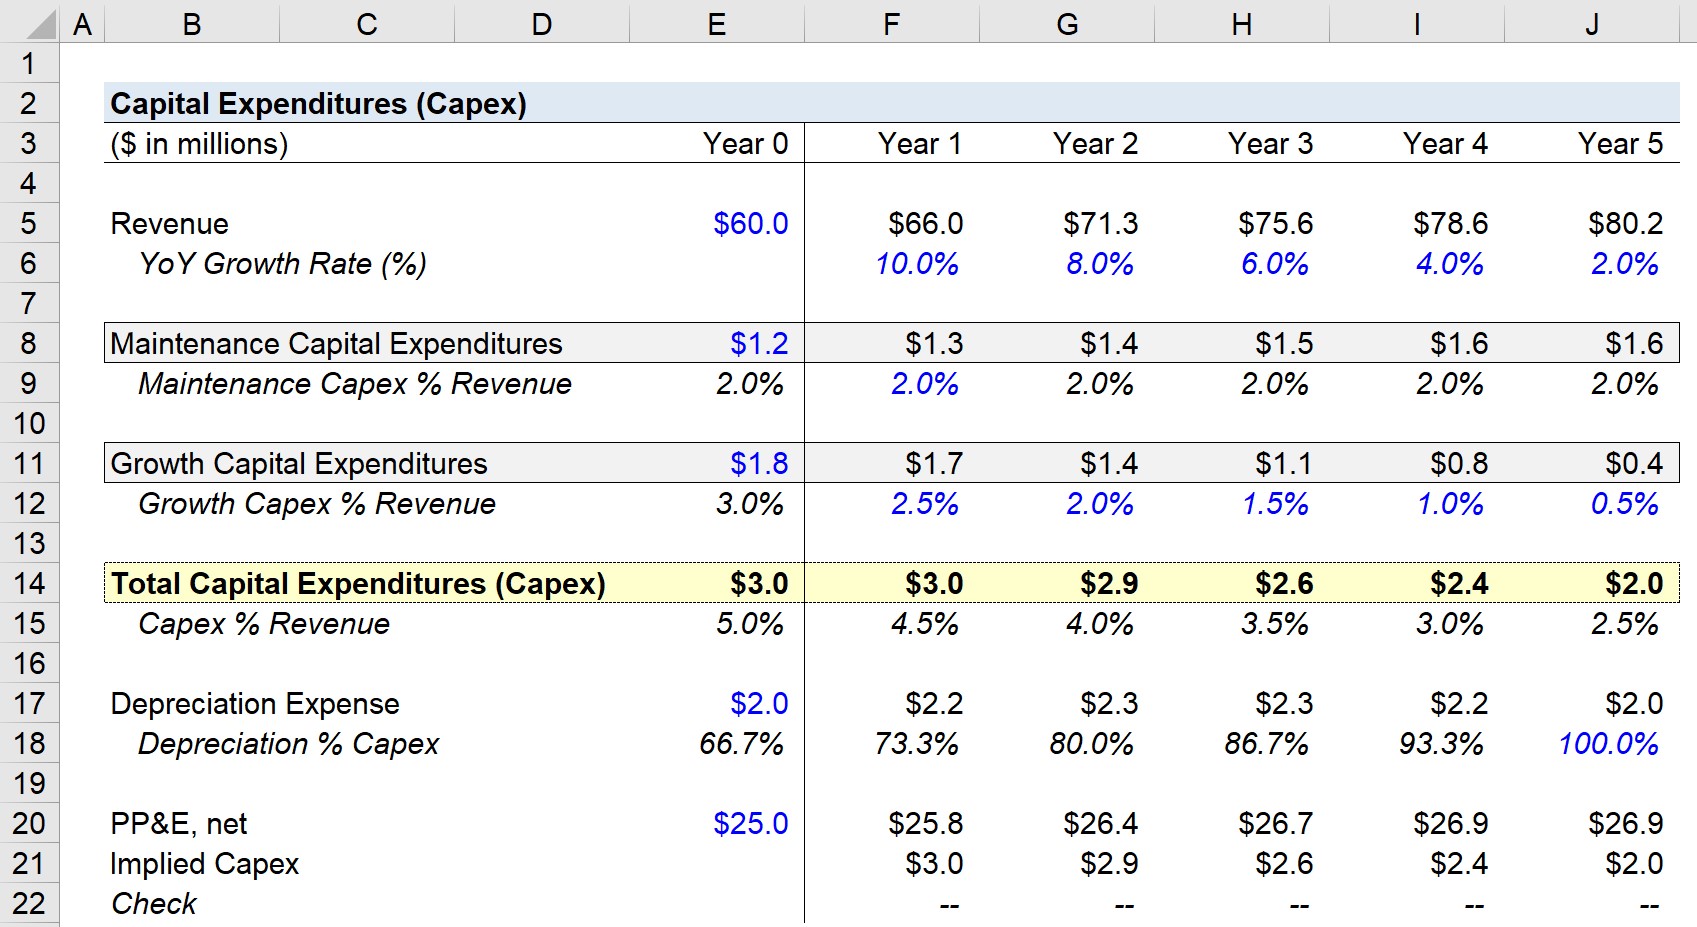
Suppose a company has revenue of $60.0m at the end of the current period, Year 0.
The growth rate of revenue is going to be 10.0% in the first year and ramp down by 2.0% each year until it reaches 2.0% in Year 5.
- Revenue, Year 0 = $60 million
- Revenue Growth %, Step Function = (2%)
2. Maintenance vs. Growth Capex Forecast
In terms of historical values for Year 0, the maintenance capital expenditure was $1.2m, while the growth capex was $1.8m. We can see that the total capex comes out to $3.0m in Year 0.
Moving onto the assumptions, maintenance capex as a percentage of revenue was 2.0% in Year 0 – and this % of revenue assumption is going to be straight-lined across the projection period.
- Maintenance Capex % Revenue = 2.0% (“Straight-Lined”)
For example, the maintenance capex in Year 2 is equal to $71.3m in revenue multiplied by 2.0%, which comes out to $1.6m.
In contrast, growth capex as a percentage of revenue is assumed to have fallen by 0.5% each year. Since the growth rate was 3.0% in Year 0, the percent assumption in Year 5 will have dropped to 0.5%.
- Growth Capex % Revenue, Year 0 = 3.0%
- Growth Capex % Revenue, Step Function = (0.5%)
The reasoning behind this assumption is the need to align the slow-down in revenue with a lower amount of growth capex.
3. Capital Expenditure Calculation Example
Once those two metrics are filled out for the entire forecast, they can be added together for the total capital expenditures for each year.
The total capex decreases as a percentage of revenue from 5.0% to 2.0% by the final year.
There are two additional assumptions listed below the maintenance vs. growth calculation area:
- Year 0 Depreciation = $2 million
- Year 0 PP&E, net = $25 million
If we have the total capital expenditures and depreciation amounts, net PP&E can be computed, which is what we’re working towards.
4. Depreciation to Capex Ratio Analysis
In the historical period (Year 0), the ratio between depreciation and capex, expressed as a percentage, came in at 66.7%.
- Depreciation to Capex Ratio (%) = 66.7%
Since we’re aware that the depreciation to capex ratio should gradually shift towards 100% (or 1.0x), we’ll smooth out the assumption to reach 100% by the end of the forecast.
For each year, the formula for the assumption will be equal to the prior % capex value plus the difference between 66.7% and 100.0% divided by the number of years projected (5 years).
After doing so, we can calculate 6.7% as the amount added each year. To confirm, we can see that depreciation and total capex were both $2.0m in Year 5.
5. Capex Calculation Example
In the final two steps, we’ll project PP&E and then back out the implied capital expenditure amount using the formula mentioned earlier.
For example, in Year 1, the prior PP&E was $25.0m while capex was $3.0m and depreciation is $2.2m. Upon entering them into the formula, we get $25.8m as the current period PP&E balance.
- Ending PP&E, Year 1 = $25.0 million + $3.0 million – $2.2 million = $25.8 million
Once repeated for each forecasted year, the implied capex (as a check) can be calculated by the change in PP&E (i.e., the difference between the current and prior period PP&E) and adding back the depreciation.
So in Year 5, the ending PP&E balance remains at $26.9m (i.e. net change of zero), while the depreciation expense is $2.0m, meaning the implied capital expenditure (capex) is $2.0m.

Everything You Need To Master Financial Modeling
Enroll in The Premium Package: Learn Financial Statement Modeling, DCF, M&A, LBO and Comps. The same training program used at top investment banks.
Enroll Today


