
- How are the Three Financial Statements Linked?
- How to Answer, “How are the Three Financial Statements Linked?”
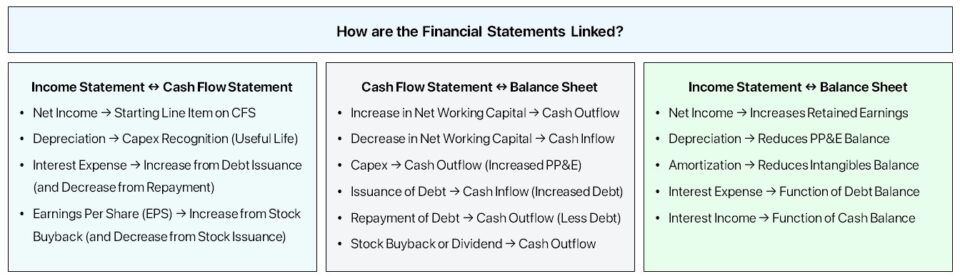
- How are the Income Statement and Cash Flow Statements Linked?
- How are the Cash Flow Statement and Balance Sheet Linked?
- How are the Income Statement and Balance Sheet Linked?
- Enhancing Financial Statement Consistency with AI
- Accounting Interview Question (with Example Answer)
- Linking the Financial Statements – Excel Template
- How to Link the Three Financial Statements in Excel
How are the Three Financial Statements Linked?
“How are the Three Financial Statements Linked?” is one of the most common accounting interview questions asked in investment banking interviews.
In the following guide, we’ll provide a comprehensive overview of how the three financial statements are conceptually connected, including examples of answers.
How to Answer, “How are the Three Financial Statements Linked?”
The three core financial statements – the income statement, balance sheet, and cash flow statement – are closely intertwined under accrual accounting.
To answer the common accounting interview question accurately, the principles of accrual accounting (U.S. GAAP) must be understood, including a familiarity with the underlying mechanisms of an integrated 3-statement model.
Otherwise, your response to the interview question will be sub-par and based on mere memorization, rather than a real understanding of the interconnections between the three financial statements.
| Financial Statement | Description |
|---|---|
| Income Statement (I/S) |
|
| Balance Sheet (B/S) |
|
| Cash Flow Statement (CFS) |
|
How are the Income Statement and Cash Flow Statements Linked?
Starting off, the cash flow statement is connected to the income statement through net income.
Net income, or the “bottom line” of the income statement, is the starting line item at the top of the cash flow statement in the cash from operations (CFO) section.
From there, net income is adjusted for non-cash expenses, most notably depreciation and amortization (D&A) and the change in the working capital line items to measure the real cash impact in the period.
- Increase in Net Working Capital (NWC) → An increase in NWC represents an outflow of cash, as more cash is tied up in operations
- Decrease in Net Working Capital (NWC) → In contrast, a decrease in NWC is an inflow of cash.
Note: The formula to calculate the “Cash Flow from Operations” section is far more complicated in real-life applications.
How are the Cash Flow Statement and Balance Sheet Linked?
The cash flow statement is linked to the balance sheet because the financial statement tracks the change in the working capital accounts, i.e. the increase or decrease in working capital.
- Increase in Operating Current Asset → Cash Outflow
- Decrease in Operating Current Asset → Cash Inflow
- Increase in Operating Current Liability → Cash Inflow
- Decrease in Operating Current Liability → Cash Outflow
The impact of capital expenditures – i.e. the purchase of PP&E – is also reflected on the cash flow statement. Capex increases the PP&E account on the balance sheet but does NOT appear on the income statement directly.
- Capital Expenditures (Capex) → Cash Outflow
- Purchase of Intangible Assets → Cash Outflow
Instead, the depreciation expense – i.e. the allocation of the Capex amount across the useful life assumption – reduces the recorded value of the fixed asset (PP&E) on the balance sheet.
In addition, the issuance of debt or equity to raise capital increases the corresponding amount on the balance sheet, while the cash impact is reflected on the cash flow statement.
- Issuance of Debt → Cash Inflow
- Repayment of Debt → Cash Outflow
- Issuance of Equity→ Cash Inflow
- Stock Buyback → Cash Outflow
- Issuance of Dividend → Cash Outflow
Finally, the ending cash balance at the bottom of the cash flow statement flows to the balance sheet as the cash balance for the current period.
3-Statement Modeling Sign Convention
In the PP&E roll-forward schedule, be sure to maintain consistency throughout the model and pay close attention to the formulas.
- Capital Expenditures (Capex) → Increase in Ending PP&E Balance
- Depreciation → Decrease in Ending PP&E Balance
For example, Capex should be subtracted from the PP&E balance if using the negative sign convention for expenses and expenditures – i.e. the double-negative makes a positive (+).
How are the Income Statement and Balance Sheet Linked?
The income statement is connected to the balance sheet via retained earnings, which represents the cumulative sum of all net earnings (or losses) of the company minus dividends issued to shareholders
The concept of retained earnings is the centerpiece that links the three financial statements together.
The retained earnings balance in the current period is equal to the prior period’s retained earnings balance plus net income minus any dividends issued to shareholders in the current period.
In practice, publicly traded companies have the option to either retain the cash generated in a given period for reinvestment activities (e.g. capital expenditures, funding working capital needs), shareholder dividend issuances, and cash-funded stock buybacks (or repurchases).
Therefore, the “Retained Earnings” line item on the balance sheet represents the cumulative profits kept by a company since inception, as opposed to engaging in shareholder dividend issuances.
Each period, the portion of net income kept by the company and not paid as dividends to shareholders flows into the retained earnings line item on the balance sheet (and increases its ending balance).
Two other examples of connections between the income statement and cash flow statement are the following:
- Interest Expense and Debt Balances → Interest expense, the cost of borrowing, is expensed on the income statement and calculated from the beginning and end of period debt balances on the balance sheet. Hence, the reduction of outstanding debt on the balance sheet via principal amortization causes the interest expense burden to decrease.
- Fixed Asset (PP&E) and Depreciation → The fixed assets (or PP&E) line item on the balance sheet is reduced by depreciation, which is a non-cash expense embedded within the cost of goods sold (COGS) and operating expenses (OpEx) line items on the income statement.

Enhancing Financial Statement Consistency with AI
Understanding how the income statement, balance sheet, and cash flow statement interconnect is fundamental to financial modeling, yet it can be difficult to maintain consistency across statements. Artificial intelligence addresses this challenge by automatically validating links between reports and identifying hidden discrepancies. Wall Street Prep and Columbia Business School Executive Education created the AI for Business & Finance Certificate Program to help professionals apply AI to integrated reporting, improving accuracy, speed, and strategic insight.
Accounting Interview Question (with Example Answer)
With the conceptual explanation now complete, here is an example response to the interview question, “How are the three financial statements linked?
Interview Question – Example Response
“The bottom line of the income statement is net income, the accrual based profit metric, inclusive of all operating and non-operating costs.
Net income flows in as the starting line item on the cash flow statement, which is reconciled in the cash flow from operations section. For example, non-cash expenses like D&A and changes in working capital line item to arrive at cash flow from operations (CFO).
The ending cash balance calculated on the cash flow statement (CFS) is the current period cash balance on the balance sheet. Net income also flows into the shareholders’ equity account via retained earnings, the cumulative net earnings to date kept by a company instead of issuing dividends to shareholders.
Each balance sheet item that impacts cash – i.e. working capital, financing, PP&E, etc. – are linked to the cash flow statement (CFS), as either a “source” or “use” of cash.”
Linking the Financial Statements – Excel Template
We’ll now move to a modeling exercise, which you can access by filling out the form below.
How to Link the Three Financial Statements in Excel
1. Reconcile Net Income for Non-Cash Items (D&A)
Suppose we’re tasked with reconciling the cash flow statement (CFS) as part of preparing the three financial statements.
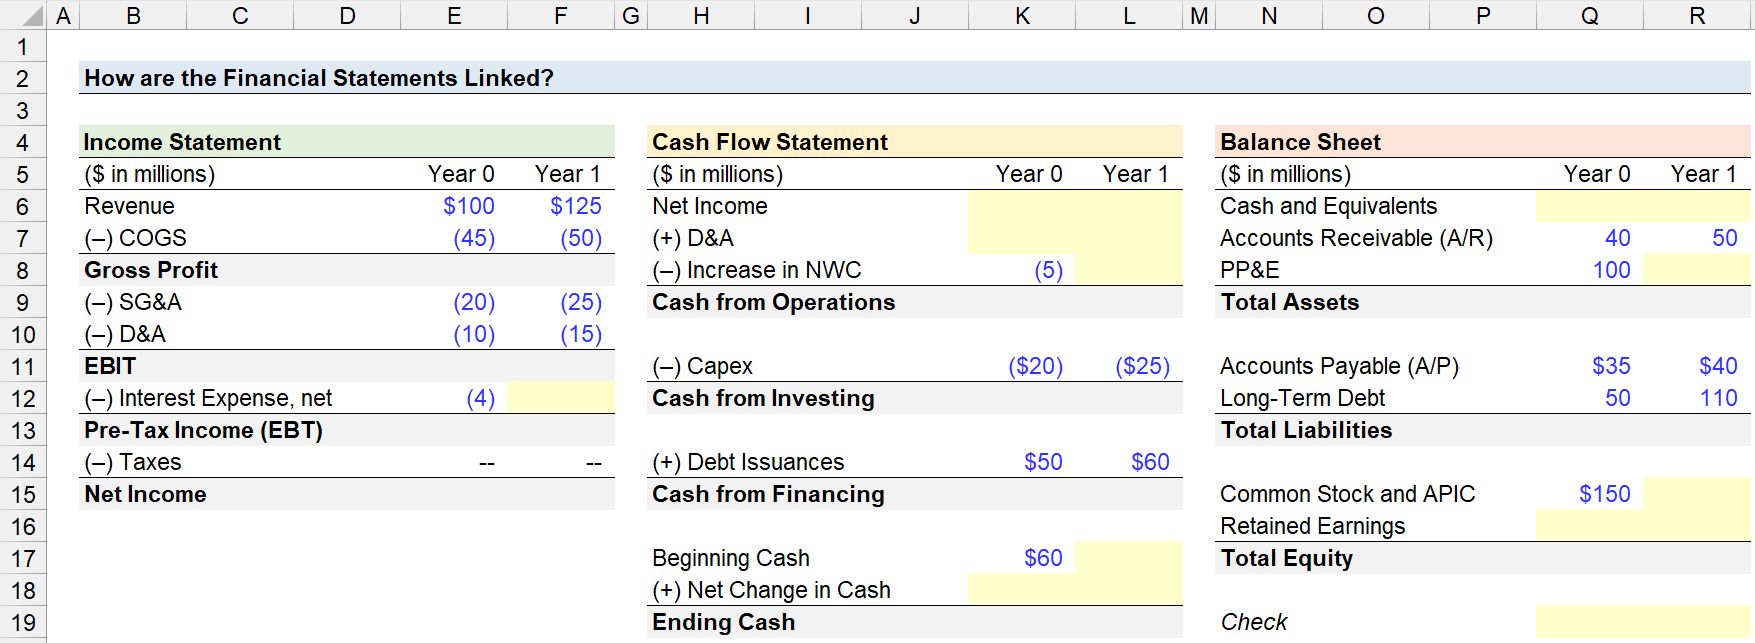
In our first step, we’ll start by linking the $15 million in net income from the income statement to the top of the cash flow statement (CFS), where the accrual accounting profit metric is the starting line item of the Cash from Operations section.
The process of reconciling net income on the cash flow statement (CFS) usually starts with the add-back of depreciation and amortization (D&A) – the most significant non-cash add-back for companies in most industries, aside from a few exceptions.
The real cash outlay, Capex, already occurred and was recognized in the cash from investing section (CFI) in the period of occurrence.
For example, the $10 million in D&A expensed on the income statement in Year 0 is added back on the cash flow statement CFS.
Note: The D&A expense is ordinarily embedded within COGS and operating expenses (OpEx) on the income statement – however, we’ve separated out the expense on our income statement for illustrative purposes.
Non-Cash Items in Reconciliation of Net Income
Other examples of non-cash items, or non-recurring items, frequently recorded on the cash flow statement (CFS) include the following:
- Stock-Based Compensation (SBC)
- Inventory Write-Down or Inventory Write-Off
- Goodwill Impairment
- Deferred Income Taxes (DTL / DTA)
2. Cash Balance and Change in Net Working Capital (NWC)
The change in net working capital (NWC) captures the difference between the prior period and current period net working capital (NWC) balance.
If the change in net working capital (NWC) is positive, that reflects an outflow of outflow (and vice versa).
- Positive Change in NWC → Decrease in Cash on Hand (Cash Outflow)
- Negative Change in NWC → Increase in Cash on Hand (Cash Inflow)
Why? Suppose a company’s accounts receivable (A/R) balance increased year-over-year (YoY).
The increase of A/R means that the number of customers that paid on credit has increased – which is a cash outflow as the company has yet to receive the cash from the customer despite “earning” the revenue under accrual accounting revenue recognition standards (ASC 606).
From Year 0 to Year 1, accounts receivable (A/R) increased by $10 million while accounts payable (A/P) increased by $5 million.
- Change in Accounts Receivable → +$10 million (Cash Outflow)
- Change in Accounts Payable → +$5 million (Cash Inflow)
The net change in NWC is $5 million, which reduces the company’s ending cash balance – i.e. the cash outflow offset and exceeded the cash inflow.
- Change in Net Working Capital (NWC) → +$5 million
3. PP&E, Capital Expenditures (Capex) and Depreciation Expense
Going further down the cash flow statement (CFS), the “Capital Expenditures” line item appears in the Cash from Investing (CFI) section.
Capex does not impact the income statement directly, but rather, the depreciation expense is periodically recognized to “spread” the cost of the outflow.
Why? The concept of depreciation is meant to match the timing of the recognition of the costs with the period in which the economic benefits were received per the matching principle of accrual accounting.
On the income statement, the depreciation recognized is the cost of the purchased fixed asset minus the residual value of the fixed asset (i.e. “scrap value”), divided by the fixed asset’s useful life assumption.
Where:
- Residual Value (“Scrap Value”) → The expected liquidation value (“sale price”) of the fixed asset at the end of its useful life. In practice, most companies assume a residual value of zero to recognize a higher depreciation expense on the income statement because of the interest tax shield (i.e. tax savings from the reduced pre-tax income).
- Useful Life → The useful life assumption refers to the estimated number of years in which a non-current fixed asset (PP&E) is expected to continue to provide positive economic utility to the company.
However, note how the property, plant and equipment (PP&E) account on the balance sheet increases by the entire Capex amount in the period of occurrence.
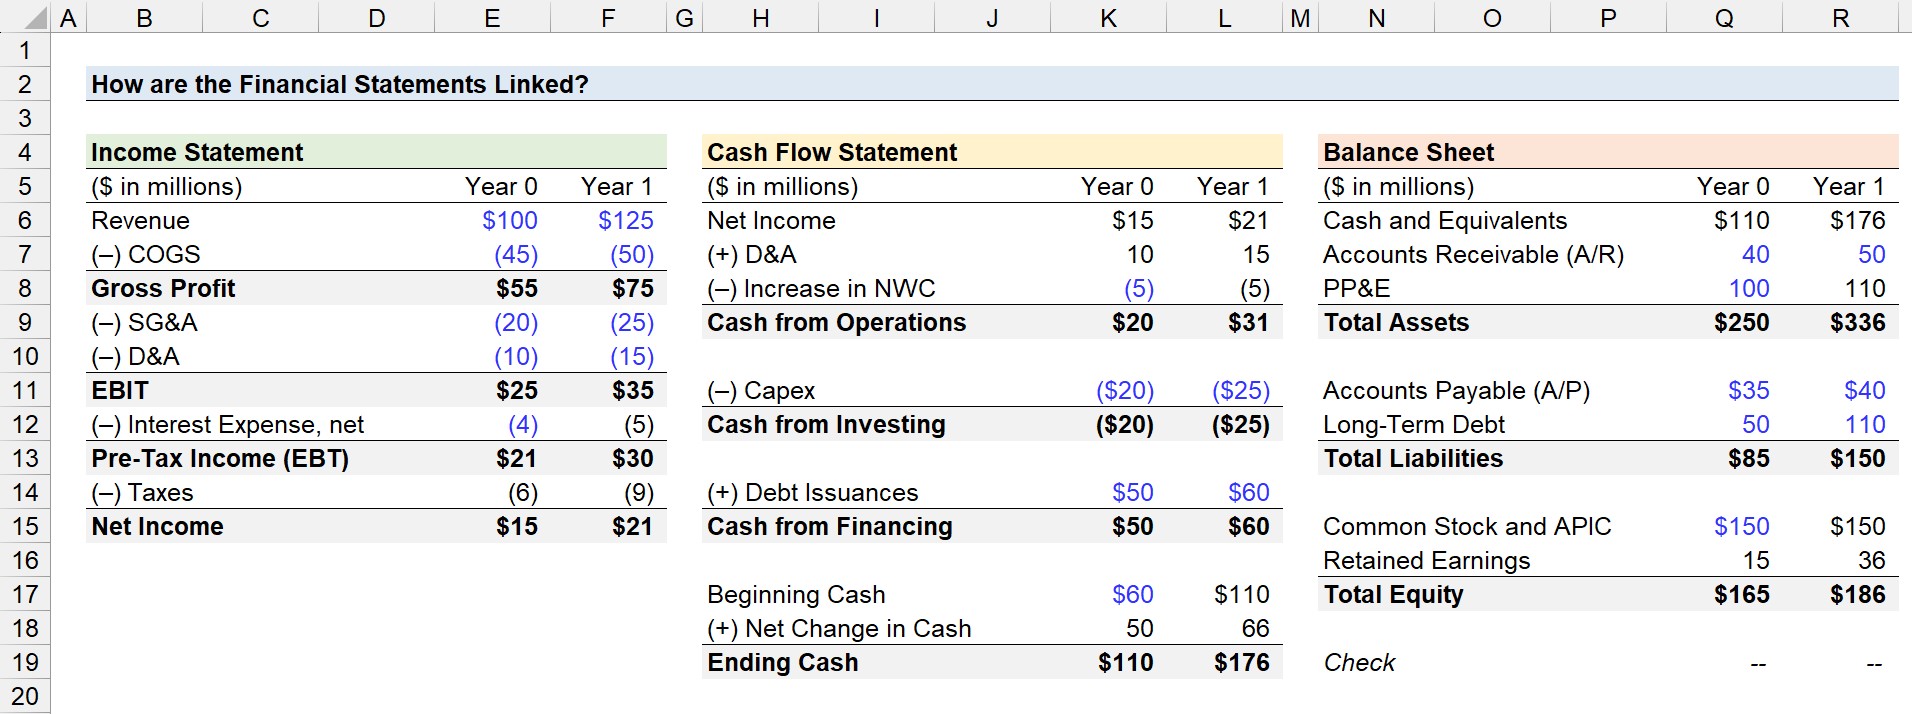
For example, the PP&E balance of $100 million in Year 0 increases by the full $20 million in Capex.
The $10 million in depreciation expense reduces the PP&E balance, so the net PP&E balance in Year 0 is equal to $110 million.
- Ending PP&E Balance = $100 million + $20 million – $10 million = $110 million
4. Interest Expense and Debt Balance (Issuance and Paydown)
For the Cash from Financing section, we have one inflow of cash, which is the raising of capital through debt issuances, which represent cash inflows, since debt is raised in exchange for cash from lenders.
In Year 0 and Year 1, our company raised $50m and then $60m, respectively – which are each recorded on the balance sheet in the “Long-Term Debt” line item.
On the income statement, the interest expense is recognized in the non-operating items section, with the recorded value determined by the average debt balance multiplied by the applicable interest rate.
For example, the interest expense in Year 1 is approximately $5 million.
- Interest Expense = 6.0% × [($50 million + $60 million) ÷ 2] = $5 million
Note: The interest expense computation here is in the context of financial modeling (i.e. a pro forma forecast); hence the simplification.
5. Retained Earnings and Ending Cash Balance
In Year 0, the beginning cash is assumed to be $60 million, and upon adding the net change in cash of $50 million – i.e. the sum of the cash from operations, cash from investing, and cash from financing sections – we arrive at $110 million for the ending cash balance.
In the cash roll-forward, the $110m in ending cash on the CFS in Year 0 flows to the cash balance shown on the balance sheet, in addition to becoming the beginning cash balance for the next year.
- Beginning Cash (Year 0)= $60 million = $50 million = $110 million
- Ending Cash (Year 1) = $110 million = $66 million = $176 million
The retained earnings account is equal to the prior period balance, plus net income, and minus any dividends issued – as mentioned earlier.
Therefore, we’ll add the current period net income of $21m to the prior period retained earnings balance of $15m to arrive at $36m for the ending retained earnings balance.
- Ending Retained Earnings = $15 million + $21 million = $36 million
In conclusion, we’ll confirm our three financial statements are linked correctly by inserting a balance check based on the fundamental accounting equation.

The Investment Banking Interview Guide ("The Red Book")
1,000 interview questions & answers. Brought to you by the company that works directly with the world’s top investment banks and PE firms.
Enroll Today


